


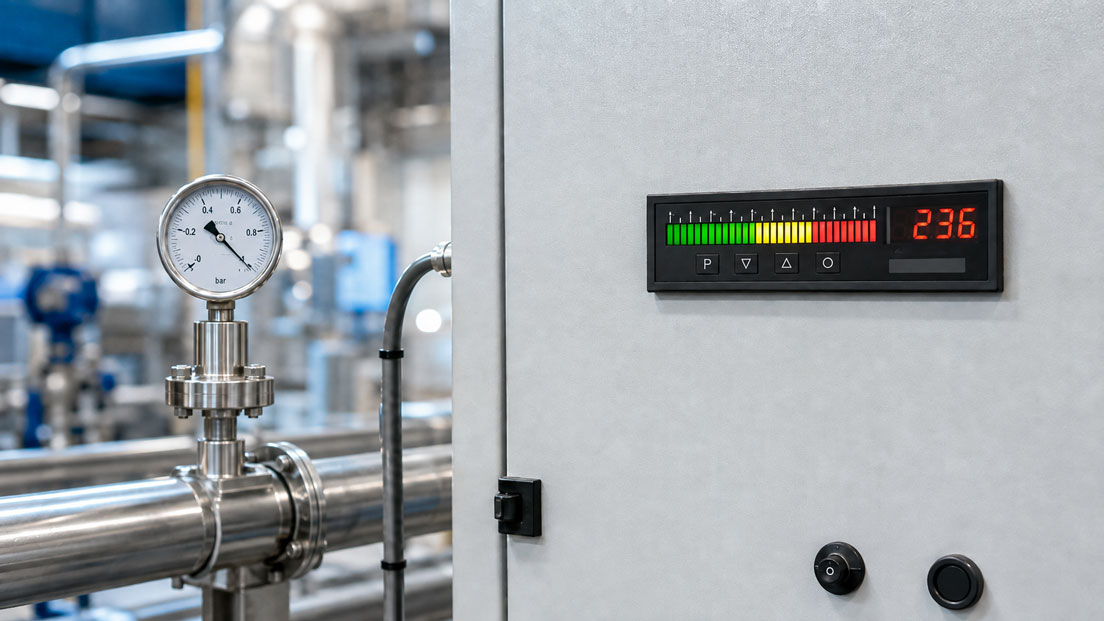
The pressure transmitter provides a stable 4–20 mA signal, but the bargraph display in the control cabinet continuously changes between alarm states. Directly at the limit value, the relay switches on and off every second, making it difficult for the operator to determine whether there is actually a process fault.
The cause does not necessarily lie in the sensor.
Reliable process visualisation with bargraph displays depends largely on correctly coordinating:
- input signal and scaling,
- zero and full-scale value,
- limit values,
- hysteresis or reset point,
- relay logic,
- colour ranges, and
- fault behaviour of the input signal
.
Compared with a purely numerical display, a bargraph display offers an additional advantage: the operator can see not only the current value but also its relative position within the entire measuring range.
If, for example, the pressure in a vessel slowly rises towards a warning threshold, this trend can often be recognised more quickly on an illuminated bar than from a single changing numerical value.
Devices for these applications can be found under Digital panel meters / digital indicators. Further solutions are grouped under Measuring instruments for control cabinet construction.
Table of Contents
- Why display a process value as a bargraph?
- Correctly assigning 4–20 mA and 0–10 V
- Scaling the display to the physical process variable
- Correctly distinguishing zero point from measuring range start
- What does segment resolution mean?
- Setting meaningful limit values
- Why limit values require hysteresis
- Correctly configuring high and low alarms
- Considering relay logic and the normally energised principle
- When an alarm delay is useful
- Using colour switching effectively
- Detecting fault currents from 4–20 mA sensors
- Supplying the sensor via the panel instrument
- Using damping and averaging correctly
- Front-panel operation and parameter protection
- Testing the bargraph display with a simulator
- Typical fault patterns
- Recommended commissioning procedure
- Practical example: tank pressure 0 to 10 bar
- Which products and solutions are suitable?
- Conclusion
- Frequently asked questions
Why display a process value as a bargraph?
A digital numerical display primarily answers the question:
What is the current measured value?
A bargraph additionally answers:
Where is this value located within the overall measuring range?
This is particularly useful for process variables where the trend or distance from a limit value should be recognisable at a glance.
Typical applications include:
- pressure,
- temperature,
- level,
- flow,
- differential pressure,
- force,
- torque,
- conductivity, or
- other process variables with a standard analogue signal.
An operator can, for example, see at a glance whether a tank is approximately:
- 20 % full,
- half full, or
- almost completely full
.
An additional digital display simultaneously provides the exact numerical value.
This combination is therefore particularly useful on machines, test benches and control panels where both rapid visual assessment and an accurate measured value are required.
Correctly assigning 4–20 mA and 0–10 V
Many process sensors provide a standard analogue signal.
Very common signals are:
- 4–20 mA and
- 0–10 V.
The display must be configured or wired for the exact input signal actually being used.
With a 4–20 mA sensor:
4 mA = measuring range start
and:
20 mA = measuring range end.
With a 0–10 V sensor, for example:
0 V = measuring range start
and:
10 V = measuring range end.
However, the electrical unit of the input signal is not yet the variable the operator wants to see.
A pressure transmitter may, for example, provide:
4–20 mA = 0–16 bar
The display should then not show 4.00 to 20.00, but directly:
0.00 to 16.00 bar.
Scaling the display to the physical process variable
The most important basic configuration is therefore the scaling of the input signal.
For a linear 4–20 mA signal, the conversion can be represented in simplified form as:
Measured value = lower limit + ((I − 4 mA) / 16 mA) × measuring span
Example:
A pressure sensor has the measuring range:
0 to 10 bar = 4 to 20 mA
At:
12 mA
the signal is exactly halfway through the current range.
The display must therefore indicate:
5.0 bar
.
Typical test points are:
| Current signal | Percentage of span | Display for 0–10 bar |
|---|---|---|
| 4 mA | 0 % | 0 bar |
| 8 mA | 25 % | 2.5 bar |
| 12 mA | 50 % | 5.0 bar |
| 16 mA | 75 % | 7.5 bar |
| 20 mA | 100 % | 10 bar |
If these five points are already incorrect, limit values and relays should not yet be configured.
The basic scaling must be correct first.
Correctly distinguishing zero point from measuring range start
A sensor measuring range does not necessarily start at zero.
A temperature sensor may, for example, be scaled as:
4–20 mA = −50 to +150 °C.
In this case:
4 mA = −50 °C
and not 0 °C.
In this example, 12 mA corresponds to:
+50 °C.
A common mistake is to enter only the full-scale value in the display while leaving the lower value at zero.
The display then responds linearly but shows incorrect values across the entire range.
For bipolar or offset measuring ranges, the following must therefore always be entered correctly:
- measuring range start and
- measuring range end.
What does segment resolution mean?
A bargraph consists of a limited number of visible segments or points.
The resolution of the bar is therefore lower than the resolution of a multi-digit digital display.
With a bargraph containing, for example, 30 segments over a range of 0 to 100 %, one segment represents approximately:
100 % / 30 ≈ 3.3 %
of the entire range.
This is not a disadvantage, but part of the display principle.
The bargraph is primarily intended to visualise:
- trend,
- utilisation,
- direction, and
- distance from critical ranges
quickly.
An additional numerical display is useful for precise reading.
With very large measuring ranges, it should also be considered whether the bargraph really needs to represent the complete sensor range.
In some cases, displaying only the process range that is actually relevant can be more useful.
Setting meaningful limit values
In addition to visualisation, a digital indicator can also be used for limit monitoring.
Typical limits include:
- high warning,
- high alarm,
- low warning, or
- low alarm.
A simple example for a vessel pressure of 0 to 10 bar:
- normal range: 0 to 7.5 bar,
- warning: from 7.5 bar,
- alarm: from 9.0 bar.
Limit values should not be selected solely according to where the bargraph looks visually appropriate.
They must be derived from the actual process limits.
These can include:
- permissible operating range,
- machine specification,
- quality limits,
- vessel or process limits, and
- intended response time of operating personnel.
Why limit values require hysteresis
A limit value without sufficient effective hysteresis can continuously switch on and off directly at the switching point.
Example:
The high alarm is set to:
8.0 bar
.
However, the actual process value fluctuates slightly:
7.99 → 8.01 → 7.98 → 8.02 bar.
Without a suitable reset differential, the relay would change state with every small fluctuation.
This results in:
- relay chatter,
- unnecessary alarm messages,
- increased contact wear, and
- unstable visualisation.
Hysteresis separates the switching point from the reset point.
For example:
Alarm ON at ≥ 8.0 bar
Alarm OFF only at ≤ 7.8 bar
The hysteresis is therefore:
0.2 bar.
Small fluctuations directly around 8.0 bar therefore no longer cause continuous switching.
Correctly configuring high and low alarms
For high-limit monitoring, the reset point is normally below the switching point.
Example:
HIGH ON: 80 °C
HIGH OFF: 77 °C
For low-limit monitoring, the logic is reversed accordingly.
Example:
LOW ON: 20 %
LOW OFF: 23 %
The process must therefore return sufficiently far into the normal range before the alarm is cleared.
The correct hysteresis depends on the process dynamics.
A very stable pressure measurement may be able to operate with a small hysteresis.
A pulsating process, on the other hand, may require a larger reset differential or an additional time delay.
Considering relay logic and the normally energised principle
With a relay output, not only the limit value but also the required switching logic must be defined.
One option is:
Relay energises when an alarm occurs.
Another option is the normally energised principle:
The relay is energised during normal operation and de-energises in the event of an alarm.
The normally energised principle can offer an additional advantage.
With suitable wiring, a failure of the supply voltage can also result in a state that is detected by the higher-level control system as a fault.
Which principle is appropriate depends on the function of the plant and the intended fault behaviour.
Before wiring, the following must also be clarified:
- normally open or normally closed contact,
- relay energised or de-energised during normal operation,
- behaviour in the event of a sensor fault, and
- behaviour if the display fails.
When an alarm delay is useful
Hysteresis and alarm delay solve different problems.
Hysteresis prevents rapid resetting directly at the limit value.
A delay, on the other hand, prevents very short limit violations from being evaluated as alarms at all.
Example:
When a pump starts, the pressure briefly rises above the warning value for 300 ms.
This condition is known by design and is not critical.
An alarm delay of, for example, one second could prevent a message from being generated every time this occurs.
However, such a delay must not be used if an immediate response is technically or safety-relatedly required.
Hysteresis and delay should therefore be configured according to the actual process dynamics and not simply because the display otherwise appears unstable.
Using colour switching effectively
On bargraph displays with multiple colours, the process status can additionally be highlighted visually.
A typical representation could, for example, be:
- Green: normal range,
- Orange or yellow: warning range,
- Red: alarm range.
Whether and how colour ranges or automatic colour switching can be linked to limit values depends on the particular device version.
During configuration, the colour should have the same logical meaning as the limit monitoring.
Problematic situations would include, for example:
- bargraph already red while the relay is still in the normal state,
- relay in alarm while the display remains green, or
- different limit values in the HMI and control cabinet display.
Such inconsistencies cause unnecessary uncertainty during operation.
Colour switching, relay alarm and, where applicable, the PLC limit should therefore be documented according to a common limit-value concept.
Detecting fault currents from 4–20 mA sensors
One advantage of a 4–20 mA signal is that 0 mA does not correspond to the normal measuring range start.
This means that certain fault conditions can generally be distinguished from the valid measuring range.
Many intelligent transmitters can output a current outside the normal 4 to 20 mA range in the event of a fault.
The actual fault-current values depend on the sensor and its configuration.
It must therefore be checked:
- which current the sensor outputs in the event of a fault,
- which extended input range the display supports, and
- how the display responds to underrange or overrange conditions.
A sensor fault should not simply be interpreted as an extremely low or high physical process value.
Example:
A 0–10 bar pressure sensor outputs a current below the regular 4 mA range in the event of a diagnostic fault.
The process indicator should ideally recognise this condition as:
signal fault or underrange
rather than simply displaying a negative pressure value.
Supplying the sensor via the panel instrument
Some panel displays can also provide a transmitter or sensor supply.
This allows, for example, a 2-wire transmitter to be powered directly from the control cabinet.
A typical current loop then consists of:
Sensor supply → 2-wire transmitter → measuring input → return line
Before connection, however, the electrical specifications must be compared.
The following must be considered in particular:
- sensor supply voltage,
- maximum required current,
- voltage drop across the display or input,
- additional cable resistance, and
- any further devices in the current loop.
Just because a display provides a 24 V sensor supply does not automatically mean that every 2-wire transmitter can be operated from it under all load conditions.
Using damping and averaging correctly
An unstable bargraph does not necessarily indicate an electrical fault.
The actual process itself may fluctuate.
Examples include:
- pulsations downstream of pumps,
- pressure oscillations at compressors,
- moving liquid surfaces,
- vibration, or
- rapidly changing load conditions.
Depending on the display, filter, damping or averaging functions may be available.
These make the visual display calmer.
However, strong filtering has one disadvantage:
Rapid real changes are displayed with a delay.
This can be particularly problematic if the same filtered variable is also used for limit-value decisions.
It should therefore be clearly documented whether:
- only the display is damped or
- the limit-value logic also works with the filtered value.
Front-panel operation and parameter protection
Front-panel configuration is practical for a panel instrument installed in a control cabinet.
Limit values can therefore be changed without removing the device.
At the same time, however, this also creates a risk:
An operator could accidentally change a safety- or quality-relevant parameter.
For devices with programming lock or access code, it should therefore be defined which parameters remain accessible during normal operation.
A sensible concept could, for example, be:
- measured value always visible,
- limit values adjustable only by authorised personnel,
- basic scaling locked, and
- changes documented.
The scaling in particular should not be changeable accidentally.
An incorrectly configured limit value is often noticed quickly.
A scaling error of only a few percent, on the other hand, may remain undetected for a long time.
Testing the bargraph display with a simulator
Before commissioning, the complete display and limit-value function should be tested.
A process calibrator or current/voltage simulator can be used for this purpose.
For an input:
4–20 mA = 0–10 bar
the following test can, for example, be carried out:
- Apply 4.00 mA → display must show 0 bar.
- Apply 8.00 mA → approximately 2.5 bar.
- Apply 12.00 mA → approximately 5.0 bar.
- Apply 16.00 mA → approximately 7.5 bar.
- Apply 20.00 mA → 10 bar.
- Slowly increase the signal to the first limit value.
- Check the relay switching point.
- Then slowly reduce the signal.
- Check the reset point.
- Determine the hysteresis from the switching and reset values.
- If applicable, test the second warning or alarm threshold.
- Check colour switching or display behaviour.
- Check fault conditions outside the normal measuring range, where applicable.
This tests more than just the display.
Scaling, limit-value logic, relays and, where applicable, signal transmission to the PLC can all be checked together.
Typical fault patterns
| Observation | Possible cause | Recommended check |
|---|---|---|
| Display shows 4 to 20 instead of the process value | Input not scaled to the engineering unit | Program lower and upper display values |
| Display is incorrect by a factor across the entire range | Incorrect scaling | Check the 4, 12 and 20 mA points |
| Relay chatters directly at the limit value | Hysteresis too small or unsuitable | Check switching and reset points |
| Short process spike continuously triggers an alarm | No alarm delay or delay too short | Evaluate process dynamics and delay |
| Bargraph is at 50 %, but the numerical value is incorrect | Different bargraph and digital scaling or configuration error | Compare all display parameters |
| Alarm colour and relay state contradict each other | Limits configured differently | Check colour and relay logic together |
| 0 mA is displayed as a normal zero value | 4–20 mA fault condition not considered | Check signal interruption and underrange behaviour |
| Display fluctuates strongly | Actual process fluctuates or signal is disturbed | Compare signal using a calibrator or multimeter |
| Sensor works with an external supply but not with the display | Insufficient current-loop voltage budget | Check supply and load resistance |
| Relay operates with reversed logic | Normally open/normally closed contact or alarm direction incorrect | Check relay logic and wiring |
Recommended commissioning procedure
- Define the measured variable: Pressure, temperature, level or another process variable.
- Document the sensor range: For example 0–16 bar.
- Check the output signal: For example 4–20 mA or 0–10 V.
- Configure the display input type: Do not confuse current and voltage inputs.
- Scale the measuring range: Enter the lower and upper display values correctly.
- Define decimal point and unit: Ensure good readability.
- Define the bargraph range: Display the complete sensor range or the relevant process range.
- Set warning and alarm limits: Use actual process requirements.
- Set hysteresis: Match it to the actual fluctuation of the process value.
- Evaluate alarm delay: Take short, non-critical process peaks into account where appropriate.
- Define relay logic: Specify normally open, normally closed and normally energised operation.
- Coordinate colour logic: If supported, clearly display normal, warning and alarm ranges.
- Define fault behaviour: Take wire break and sensor faults into account.
- Check sensor supply: If powered via the display, verify the electrical voltage budget.
- Test with a simulator: Check measuring range start, midpoint, end, alarm points and reset points.
- Protect the parameters: Activate parameter protection and document the settings.
Practical example: tank pressure 0 to 10 bar
The pressure of a buffer tank is monitored in a plant.
The pressure transmitter has:
Measuring range: 0–10 bar
Output: 4–20 mA
The value is displayed in the control cabinet using a digital indicator with a bargraph and two relays.
The required logic is:
- normal operation up to 7.5 bar,
- warning from 7.5 bar, and
- high alarm from 9.0 bar.
During initial commissioning, the high alarm is set to exactly 9.0 bar.
However, the process pressure fluctuates between approximately 8.95 and 9.05 bar.
The alarm relay therefore starts switching on and off continuously.
The display is electrically correct and the pressure sensor is also functioning properly.
The cause is the missing or unsuitable reset differential.
The configuration is therefore adjusted, for example, to the following logic:
High alarm ON: 9.0 bar
High alarm OFF: 8.7 bar
The alarm now remains active until the process is clearly back below the critical range.
In addition, the warning range is visually distinguished clearly from the normal range.
A current simulator is connected for testing.
At:
- 4 mA, the display shows 0 bar,
- 12 mA, the display shows 5 bar, and
- 20 mA, the display shows 10 bar
.
The signal is then slowly increased until the high-alarm relay switches.
Afterwards, the current is slowly reduced and it is checked whether the relay resets only at the defined reset point.
This allows:
- scaling,
- bargraph,
- limit value,
- hysteresis, and
- relay function
to be checked traceably with a single test.
Which products and solutions are suitable?
IMB3 – 96 × 24 mm bargraph display for 0/4–20 mA and 0–10 V
The IMB3 bargraph display is particularly suitable for compact control panels where the process value and limit status need to be recognised quickly.
The version for standard signals processes:
- 0/4–20 mA and
- 0–10 VDC.
It combines a digital display with a 30-point bargraph.
Depending on the version, functions or options are also available for:
- one or two relay switching points,
- limit monitoring,
- alarm delays,
- bar or dot display,
- min./max. recording,
- sensor supply,
- analogue output, or
- RS232/RS485
.
The tricolour bargraph is particularly useful when different process ranges are to be visually distinguished from one another.
IMB2 – 96 × 96 mm with 55-point bargraph and digital display
The IMB2 bargraph display offers a 5-digit digital display and a 55-point bargraph in a 96 × 96 mm housing.
It is particularly useful when, in addition to graphical representation, a clearly readable numerical display and more extensive input/output functions are required.
For standard signals, available inputs include:
- 0/4–20 mA and
- 0–10 VDC
.
Two relay outputs provide additional limit-value functions.
Depending on the version or configuration, sensor supply, analogue output and digital interfaces can also be used.
IMB1 – compact pure bargraph visualisation
For applications where a particularly compact graphical display is the main requirement, the IMB1 48 × 24 mm bargraph display is an alternative.
It also processes standard signals such as 0/4–20 mA and 0–10 V.
Depending on the version, different bargraph colours and display modes can be used.
The compact design is particularly suitable where only limited control-panel space is available and rapid visual recognition of the process value is the main priority.
Further panel indicators can be found under Digital panel meters / digital indicators.
ICS Schneider Messtechnik supports you in selecting and configuring bargraph displays and digital indicators for 4–20 mA, 0–10 V and other process signals, as well as in designing limit values, switching outputs, sensor supplies and display formats.
Conclusion
A bargraph display is more than just a visual addition to a digital indicator.
When configured correctly, it shows at a glance:
- where the current process value is located,
- in which direction the process is developing, and
- how far the value is from warning or alarm limits.
The prerequisite for this is correct scaling.
A 4–20 mA or 0–10 V signal must be converted into the actual physical process variable.
Only then should limit values be configured.
Hysteresis is particularly important.
It prevents a relay from continuously switching on and off due to small fluctuations directly around the limit value.
An alarm delay can additionally suppress brief limit violations that are permissible due to normal process behaviour.
With multicolour displays, colour, relay state and PLC alarm should all have the same logical meaning.
Fault currents and wire breaks must also form part of the configuration concept. A defective sensor signal must not be interpreted unnoticed as a plausible process value.
Commissioning should therefore always be carried out using a current or voltage simulator.
Checking at least the start, midpoint and end of the measuring range as well as the alarm switching and reset points reveals most configuration errors before the plant enters operation.
The most important rule is:
First scale the input signal correctly, then define limit values and hysteresis, and only afterwards build colour indication, relays and alarm messages around them.
Frequently asked questions about bargraph displays
What is a bargraph display?
A bargraph display represents a measured value as an illuminated bar or series of segments. This allows the relative position of the current measured value within the measuring range to be recognised more quickly than with a purely numerical display.
Can a bargraph display directly indicate a 4–20 mA signal?
Yes, provided the display has a suitable current input. The signal should be scaled to the actual process variable, for example 4–20 mA to 0–10 bar.
What does a 4–20 mA display show at 12 mA?
12 mA corresponds to exactly 50 % of the electrical measuring span. With a 0–10 bar sensor, the display should therefore indicate 5 bar.
Why does the limit relay chatter?
A common cause is insufficient or missing hysteresis. If the measured value fluctuates directly around the switching point, the relay can otherwise continuously switch on and off.
What is hysteresis on a digital indicator?
Hysteresis is the difference between the switching point and the reset point of a limit value. An alarm can, for example, switch on at 8.0 bar and reset only at 7.8 bar.
What is the difference between hysteresis and alarm delay?
Hysteresis prevents repeated switching directly at the limit value. An alarm delay, on the other hand, requires the limit to remain exceeded or undershot for a defined period before the alarm is activated.
Which colours should a bargraph use?
A commonly useful logic is green for normal operation, orange or yellow for warning and red for alarm. The actual colour logic, however, depends on the display being used and the plant concept.
Can the display also detect a sensor fault?
This depends on the sensor and the panel instrument. With 4–20 mA transmitters, fault states can be signalled by currents outside the normal measuring range. The display must be configured so that such values are recognised or displayed accordingly.
Can a digital indicator supply a 2-wire sensor?
Some devices provide an integrated sensor or transmitter supply. Before connection, however, the supply voltage, current requirement and complete voltage budget of the 4–20 mA loop must be checked.
How do I test a bargraph display?
The easiest method is to use a process calibrator or current/voltage simulator. For a 4–20 mA input, at least the measuring range start, midpoint and end as well as all switching and reset points of the limit values should be tested.