


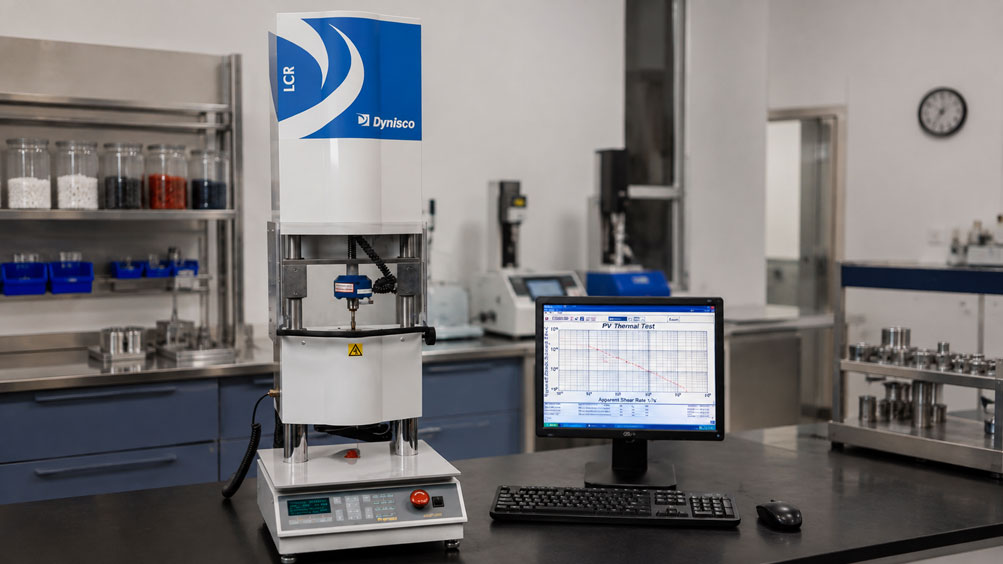
In plastics processing, a single viscosity value alone does not determine how a polymer behaves in an extruder, during injection molding or in a die. Polymer melts are generally non-Newtonian: their viscosity changes with shear rate, temperature and, in the case of sensitive materials, also with residence time. A capillary rheometer therefore enables a much more detailed characterization of flow behavior than a single MFR or MVR measurement.
The measuring principle initially appears simple: a temperature-controlled polymer melt is forced through a capillary at a defined speed. Shear rate, shear stress and shear viscosity are determined from volumetric flow rate, capillary geometry and pressure or piston force. In practice, however, even differences in capillary diameter, L/D ratio, pressure measurement or temperature control can result in two otherwise comparable samples appearing to have different flow curves.
For development, compounding and quality assurance, it is therefore important to distinguish between apparent measured quantities and corrected rheological quantities. A higher measured pressure does not automatically mean that the material actually has a higher shear viscosity. Entrance pressure losses, an unsuitable pressure measuring range, wall slip, material degradation or a contaminated capillary can also affect the result.
For corresponding investigations, ICS Schneider offers capillary rheometers for the rheological characterization of polymer melts. For pressure measurement in plastic melts, melt pressure sensors for extrusion and polymer applications are also available.
Table of Contents
- What does a capillary rheometer measure?
- Why polymer melts are non-Newtonian
- Capillary geometry and L/D ratio
- Why pressure measurement is so important
- Pressure channels and position of pressure measurement
- Apparent shear rate, shear stress and viscosity
- Bagley correction: accounting for entrance pressure losses
- Rabinowitsch correction: accounting for non-Newtonian behavior
- Detecting and evaluating wall slip
- Temperature uniformity, residence time and material degradation
- Extrudate surface as additional information
- Typical fault patterns
- Systematic troubleshooting procedure for unusual measurement results
- Cleaning the capillary and pressure channel
- Measurement uncertainty and repeatability
- Practical example: apparent difference between two material batches
- Suitable capillary rheometers from Dynisco
- Conclusion
- FAQ
What does a capillary rheometer measure?
In a capillary rheometer, a defined quantity of the material to be tested is melted or temperature-conditioned in a heated barrel. A piston then forces the melt at a defined speed through a capillary with a known internal diameter D and known length L.
Depending on the measuring system, the following quantities, among others, are measured or calculated from the measurement data:
- piston speed and volumetric flow rate,
- piston force or melt pressure,
- melt temperature,
- apparent shear rate,
- apparent wall shear stress,
- apparent shear viscosity,
- corrected rheological quantities,
- change in viscosity over time.
Typically, a flow curve is generated in which shear viscosity is plotted against shear rate. This makes it possible to assess how strongly a polymer shear-thins as processing speed increases.
The advantage compared with a simple melt flow index test is that not only a single operating point is considered. Instead, the material can be investigated over a broader shear-rate range that can be matched more specifically to actual processing conditions.
Why polymer melts are non-Newtonian
In an ideal Newtonian fluid, viscosity remains constant regardless of shear rate. Most polymer melts, however, exhibit shear-thinning behavior: their apparent viscosity decreases as shear rate increases.
In simplified terms, this can be explained by the fact that polymer chains become increasingly oriented in the direction of flow as the flow load increases. This allows the melt to flow more easily.
A statement such as “The material has a viscosity of 500 Pa·s” is therefore of limited significance without specifying the measurement conditions. A viscosity value should at least be accompanied by:
- temperature,
- shear rate or shear stress,
- capillary geometry,
- correction method applied,
- material condition and, where applicable, drying,
- residence time at test temperature.
Particularly when comparing different material batches, these conditions must be kept as identical as possible. Otherwise, a difference in the measuring method may incorrectly be interpreted as a material difference.
Capillary geometry and L/D ratio
Capillary geometry has a direct influence on the calculation of rheological quantities. The most important parameters are the internal diameter D and the length L of the capillary.
The ratio of length to diameter is specified as the L/D ratio:
L/D = capillary length / capillary diameter
A capillary with a length of 20 mm and an internal diameter of 1 mm, for example, has an L/D ratio of 20.
With a long capillary, a greater proportion of the total pressure loss occurs along the actual capillary section. With a very short capillary, by contrast, the additional pressure loss at the capillary entrance becomes relatively more significant.
When transitioning from the comparatively large measuring barrel into the much smaller capillary, the flow is strongly accelerated and redirected. The pressure required for this process is not entirely attributable to the pressure loss of the fully developed capillary flow.
For this reason, material comparisons should always document:
- capillary diameter,
- capillary length,
- L/D ratio,
- entrance geometry,
- capillary material or design,
- condition and cleanliness of the capillary.
Why capillary diameter is particularly critical
The diameter enters the calculation of apparent shear rate to the third power. A comparatively small deviation in the actual diameter can therefore already have a significantly greater influence on the calculated shear rate.
Wear, deposits or an insufficiently cleaned capillary are therefore not merely mechanical issues, but directly affect rheological measurement accuracy.
Why pressure measurement is so important
Wall shear stress is determined from the pressure loss and capillary geometry. An error in pressure measurement therefore directly affects the calculated shear viscosity.
Depending on the design of the capillary rheometer, the load acting on the melt can be measured via the piston force or directly by means of a melt pressure sensor installed in the measuring barrel.
Direct pressure measurement in the melt can be particularly advantageous when influences from the piston mechanics are to be separated as far as possible from the actual pressure measurement. However, it does not automatically mean that the indicated pressure was generated exclusively within the capillary. Pressure losses also occur between the pressure measuring point and the capillary as well as at the capillary entrance.
The pressure measuring range must match the measurement task
One frequently underestimated factor is the selection of the pressure measuring range. A very large measuring range provides considerable overload reserve, but at low pressures only a small part of the available measurement signal may be used.
As a result, the following effects may become relatively more significant:
- zero-point deviation,
- signal noise,
- resolution,
- temperature-related zero shift.
Conversely, a measuring range that is too small is also unsuitable if there is a risk of overload at high shear rates or when testing a particularly high-viscosity material.
A practical rule is therefore:
The pressure range should be as small as practical for good measurement resolution, but large enough for the highest expected process pressure.
Before carrying out an extensive test series, it is therefore advisable to perform an initial trial and determine the actual pressure range occurring over the planned shear rates.
Pressure channels and position of pressure measurement
With capillary rheometers using direct pressure measurement, it must be known where the respective pressure is measured. A pressure sensor always measures the local pressure at its actual measuring point. This value does not automatically correspond to the pure pressure drop within the capillary.
If the pressure sensor is located above the capillary, the measured value may, for example, include:
- pressure loss between the pressure measuring point and the capillary,
- entrance pressure loss,
- pressure loss within the capillary.
Particularly with instruments featuring several pressure or measuring channels, it must therefore be clearly documented which sensor and which capillary correspond to each measured value.
Before starting a test series, at least the following points should be checked:
- Which pressure channel is being used?
- Which pressure sensor is assigned to this channel?
- What is the sensor’s measuring range?
- Which capillary is installed?
- Is the pressure channel clean and completely exposed to the melt?
- Was the pressure sensor zeroed or checked at a stable test temperature?
The final point is particularly important. With high-temperature melt pressure sensors, the zero point can shift during heating. If a sensor is zeroed at room temperature and then operated at a high melt temperature, this may result in a systematic offset.
Apparent shear rate, shear stress and viscosity
The rheological values initially calculated directly from volumetric flow rate, geometry and pressure are often referred to as apparent quantities. They are based on simplifying assumptions and form the starting point for further corrections.
Apparent shear rate
For a circular capillary, the apparent shear rate at the wall can be determined using the following relationship:
γ̇app = 32 · Q / (π · D³)
Where:
- γ̇app = apparent shear rate in s-1,
- Q = volumetric flow rate,
- D = internal diameter of the capillary.
Apparent wall shear stress
If it is initially assumed that the entire measured pressure drop occurs within the capillary, the following relationship applies:
τapp = Δp · D / (4 · L)
Where:
- τapp = apparent wall shear stress,
- Δp = measured pressure drop,
- D = capillary diameter,
- L = capillary length.
Apparent shear viscosity
Shear viscosity is then obtained from shear stress and shear rate:
ηapp = τapp / γ̇app
For purely comparative testing, apparent values can already be very useful provided that all test conditions remain constant. For a physically more accurate characterization of the polymer melt, however, entrance losses and the non-Newtonian flow profile often need to be taken into account.
Bagley correction: accounting for entrance pressure losses
The simple calculation of wall shear stress initially assumes that the entire measured pressure loss occurs within the cylindrical capillary. In a real capillary rheometer, however, this is not completely the case.
At the entrance from the larger measuring barrel into the small capillary, the melt is accelerated and the flow is strongly reshaped. This requires additional pressure. If this entrance pressure loss is attributed entirely to the capillary, wall shear stress and the viscosity derived from it are overestimated.
The Bagley correction is used to determine this additional pressure component.
How is a Bagley correction performed?
For a conventional Bagley analysis, capillaries are used that:
- have the same diameter,
- have a comparable entrance geometry,
- but have different capillary lengths or L/D ratios.
At the same apparent shear rate, the required pressure is determined for each capillary. The pressure is then plotted against the respective L/D ratio.
The measured values are extrapolated to L/D = 0. The resulting pressure-axis intercept corresponds to the additional pressure component that should not be attributed to fully developed flow along the capillary length.
If this component is designated as pe, the corrected wall shear stress can be calculated in simplified form as:
τw = (Δp − pe) · D / (4 · L)
Mathematically, a straight line can already be determined using only two capillary lengths. For a reliable practical evaluation, however, several L/D ratios are preferable because they also allow verification of whether the pressure relationship is sufficiently linear.
When is particular caution required?
If the pressure plotted against L/D does not show a plausible linear relationship, the values should not simply be extrapolated without further investigation. Possible causes include:
- material degradation during the test series,
- non-steady-state flow,
- significant self-heating of the melt,
- wall slip,
- different actual capillary diameters,
- different entrance geometries.
Important: Direct pressure measurement immediately above the die does not automatically make the Bagley correction unnecessary. The entrance pressure loss still occurs between the barrel and the fully developed capillary flow.
Rabinowitsch correction: accounting for non-Newtonian behavior
The formula for apparent shear rate is based on a Newtonian flow profile. Polymer melts, however, are usually shear-thinning. As a result, the velocity profile in the capillary differs from the Newtonian ideal.
The actual shear rate at the capillary wall can therefore differ from the initially calculated apparent shear rate.
The Weissenberg-Rabinowitsch correction, often shortened to Rabinowitsch correction, accounts for this effect.
If the relevant section of the flow curve can locally be described by a power law and n is the local slope of the relationship between shear stress and apparent shear rate on a double-logarithmic scale, the following expression can be used:
γ̇w = ((3n + 1) / (4n)) · γ̇app
For a Newtonian fluid, n = 1. The correction factor is then 1.
For a shear-thinning polymer, n is less than 1. The corrected wall shear rate is then higher than the apparent shear rate.
The corrected viscosity is calculated accordingly:
ηkorr = τw / γ̇w
Bagley and Rabinowitsch corrections must not be confused
| Correction | What is corrected? | Typical basis |
|---|---|---|
| Bagley | Additional entrance or geometry-related pressure losses | Same diameter, different L/D ratios |
| Rabinowitsch | Non-Newtonian velocity profile and the resulting actual wall shear rate | Slope of the flow curve |
The two methods therefore correct two different physical effects. For the most accurate possible flow curve, both wall shear stress and wall shear rate can therefore be corrected.
Detecting and evaluating wall slip
In classical capillary flow, it is initially assumed that the melt velocity directly at the wall is zero. This assumption is known as the no-slip boundary condition.
With certain polymer melts, highly filled compounds or special material formulations, however, relative movement can occur between the melt and the capillary wall. This behavior is referred to as wall slip.
In this case, part of the volumetric flow is no longer generated exclusively by shear deformation within the material, but additionally by slip at the wall. If the conventional no-slip assumption is nevertheless used, the apparent shear rate may appear too high and the resulting viscosity too low.
Typical indications of wall slip
Possible indications include:
- flow curves that depend systematically on capillary diameter,
- unexpected jumps or regions with strongly changing slope in the flow curve,
- stick-slip behavior,
- unusual pressure oscillations,
- changes in the extrudate surface as load increases.
However, a diameter dependency alone does not prove wall slip. Entrance losses, non-identical capillaries, material changes or insufficient temperature stability can also cause differences.
Mooney analysis for investigating wall slip
A conventional method for investigating wall slip is the Mooney analysis.
For this purpose, flow curves are recorded using capillaries with different radii. The L/D ratios should be kept comparable in order to avoid unnecessary changes in pressure conditions.
For a selected wall shear stress, the apparent shear rate is then plotted against the reciprocal of the capillary radius.
In the presence of wall slip, a systematic dependency on the radius occurs. The slip velocity at the wall can be determined or estimated from the slope.
A useful test procedure is:
- Select capillaries with different diameters.
- Use L/D ratios that are as comparable as possible.
- Record flow curves at identical material temperatures.
- Appropriately account for entrance pressure losses.
- Compare measured values at the same wall shear stress.
- Plot shear rate against the reciprocal of the radius.
- Repeat the measurement at several shear stresses.
This makes it possible not only to determine whether wall slip is likely to occur, but also to identify the load level from which the effect increases significantly.
Temperature uniformity, residence time and material degradation
The shear viscosity of polymer melts is highly sensitive to temperature changes. Even relatively small deviations can result in a visible shift of the entire flow curve.
For reproducible measurements, it is therefore not sufficient simply to set a target value on the rheometer. The measuring barrel, capillary and material must be adequately thermally stabilized.
At the same time, the sample must not remain unnecessarily long in the measuring barrel at elevated temperature.
Depending on the material, the following effects may occur during the residence time:
- thermal degradation,
- oxidation,
- chain scission,
- crosslinking,
- other chemical reactions,
- hydrolytic degradation in moisture-sensitive polymers,
- loss of volatile components.
Degradation accompanied by a decrease in average molecular weight often leads to a reduction in viscosity. Crosslinking or post-reactions, on the other hand, can also cause viscosity to increase.
Time sweep before the rate sweep
For an unknown or thermally sensitive material, it may therefore be advisable first to perform a time sweep. In this test, viscosity or pressure is observed over time at a constant temperature and defined shear rate.
If the value remains stable within the time window relevant to the application, a shear-rate sweep can subsequently be performed.
If, on the other hand, viscosity changes continuously over time, residence time must be controlled very strictly for all comparative measurements. Otherwise, the effect of shear rate and progressive material change are measured simultaneously during the test series.
For a traceable test record, filling time, preheating time, waiting time and actual measurement duration should therefore be documented in addition to temperature.
Extrudate surface as additional information
Not only the calculated viscosity value is of interest when evaluating a capillary rheometer measurement. The extrudate emerging from the capillary can also provide valuable information.
Unusual surfaces or shapes may, for example, be associated with the following phenomena:
- sharkskin,
- stick-slip flow,
- melt fracture,
- air inclusions,
- material that has not fully melted,
- contamination,
- thermal material damage.
Such effects may also be visible in the pressure signal. Regular pressure fluctuations or sudden changes should therefore not be evaluated exclusively numerically. Inspecting the extrudate often provides additional information.
A measurement point with strongly oscillating pressure and unstable extrudate should not simply be combined with stable measurement points to create a smooth flow curve.
Typical fault patterns in capillary rheometer measurements
| Observation | Possible cause | Recommended check |
|---|---|---|
| Viscosity is higher than in previous measurements | Temperature too low, entrance pressure not corrected, pressure zero shifted, capillary restricted | Check temperature, pressure zero, capillary geometry and cleanliness |
| Viscosity is lower than expected | Temperature too high, material degradation, wall slip | Check temperature and residence time; compare measurements using different capillary diameters |
| High scatter at low shear rates | Pressure signal very small relative to sensor range, non-steady-state condition | Check pressure-time curve and use a suitable pressure measuring range |
| Results depend on L/D ratio | Entrance pressure loss not sufficiently accounted for | Perform Bagley analysis |
| Results depend on capillary diameter | Wall slip or other geometry effects | Perform Mooney analysis or diameter comparison |
| Pressure continuously increases during a measurement point | Material reaction, crosslinking, blockage or steady state not yet reached | Perform a time sweep and inspect the capillary |
| Pressure or viscosity decreases with increasing residence time | Possible thermal or hydrolytic material degradation | Investigate material drying and time-dependent stability |
| Short pressure spikes | Air bubble, contamination or insufficiently homogenized sample | Check sample preparation and pressure-time signal |
| Results change after changing material | Residual material in the measuring barrel, pressure channel or capillary | Check cleaning and purging procedure |
| Zero point changes after heating | Temperature-dependent zero shift of the pressure sensor | Check zero point at a stable test temperature |
Systematic troubleshooting procedure for unusual measurement results
If a new material batch suddenly shows a different viscosity from the previous batch, a material defect should not immediately be assumed. A systematic troubleshooting procedure is more appropriate.
- Check material identity: Are polymer type, grade, batch and additive formulation correct?
- Check material conditioning: Was the sample dried or preconditioned correctly?
- Check temperature: Are the setpoint and actual measurement temperature stable?
- Compare residence time: Were both samples tested using the same timing sequence?
- Identify the capillary: Are diameter, length and L/D ratio correct?
- Inspect the capillary: Are the bore and entrance clean and undamaged?
- Check pressure measurement: Are the sensor, measuring range, pressure channel and zero point correct?
- Evaluate the pressure-time signal: Was a sufficiently stable measurement condition actually reached?
- Check the Bagley effect: Could different entrance pressure losses explain the deviation?
- Check the Rabinowitsch evaluation: Are apparent or corrected shear rates being compared?
- Investigate wall slip: Is there a systematic dependency on capillary diameter?
- Repeat the measurement: Only a reproducible difference should be assessed as an actual material deviation.
Cleaning the capillary and pressure channel
A clean capillary is a basic prerequisite for reproducible rheological measurements. Deposits change the actual free diameter and therefore directly affect the calculated shear rate.
Particularly critical are:
- carbonized polymer residues,
- residues from previous materials,
- fillers and pigments,
- deposits at the capillary entrance,
- deposits in the pressure channel,
- mechanical damage to the capillary bore.
The pressure channel of a directly mounted melt pressure sensor must also be free of old material residues. Deposits can impair pressure transmission and alter the dynamic behavior of the measurement signal.
Cleaning should be performed in accordance with the instructions of the instrument or sensor manufacturer. In particular, the diaphragm of a melt pressure sensor is sensitive and must not be damaged with unsuitable tools.
Measurement uncertainty and repeatability
The resulting flow curve does not depend on a single measured quantity. Accordingly, the overall uncertainty consists of several contributions.
Relevant factors include:
- accuracy and stability of pressure or force measurement,
- capillary diameter,
- capillary length,
- piston speed and the resulting volumetric flow rate,
- temperature measurement and temperature uniformity,
- material conditioning,
- residence time,
- sample homogeneity,
- selection and mathematical implementation of corrections.
For practical quality assurance, repeatability is often at least as important as the theoretical overall measurement uncertainty.
A useful approach is to measure a known reference or control material several times under defined conditions. This provides an indication of how much the entire system comprising instrument, operator, temperature control, capillary and evaluation actually varies.
If a control curve shifts over time, the measurement chain should first be checked before deviations in production materials are assessed.
Practical example: apparent difference between two material batches
In the quality assurance department of a compounder, a new batch of a thermoplastic material is investigated. At medium shear rates, the measured apparent viscosity is approximately 10% higher than the previous values.
The initial assumption is that the new batch has a higher molecular weight or a modified formulation.
Before drawing such a conclusion, however, the measurement is systematically reviewed.
Step 1: Temperature
The target temperature is identical. After sufficient stabilization, the temperature measurement also shows no relevant deviation.
Step 2: Residence time
Both samples were tested with comparable preheating and measurement times. A separate time sweep shows no significant material change within the period considered.
Step 3: Capillary
When comparing the test records, it becomes apparent that a different capillary length was used for the current measurement. Although the diameter is the same, the L/D ratio is considerably smaller.
Step 4: Entrance pressure loss
With the shorter capillary, entrance pressure loss accounts for a greater proportion of the total measured pressure. If this pressure is fully included in the simple calculation of wall shear stress, the viscosity appears too high.
Step 5: Corrected evaluation
After performing a Bagley analysis using several capillary lengths, the corrected flow curves of the two material batches are significantly closer to each other.
Result: The initially observed difference was caused to a considerable extent by different measuring conditions. Without checking the capillary geometry, this might incorrectly have been interpreted as a material deviation.
This example demonstrates why capillary rheometry should not focus solely on the final viscosity value. Pressure signal, capillary geometry and the corrections applied must always be considered together as part of the measurement.
Suitable capillary rheometers from Dynisco
For the rheological characterization of polymer melts, Dynisco offers laboratory capillary rheometers from the LCR7000 series. The LCR7000, LCR7001 and LCR7002 versions are available from ICS Schneider for different measurement tasks.
Selection should primarily be based on whether force measurement, direct melt pressure measurement or comparative measurements using two capillaries are required.
| Model | Measuring concept | Typical application |
|---|---|---|
| Dynisco LCR7000 | Single measuring barrel, force measurement via load cell | Classical capillary rheology based on piston force |
| Dynisco LCR7001 | Single measuring barrel, force measurement and/or direct pressure measurement in the barrel | Investigations in which melt pressure is additionally measured directly |
| Dynisco LCR7002 | Two measuring barrels with two pressure sensors and twin-die measurement capability | Comparison of different capillary geometries as well as investigation of entrance pressure losses and Bagley corrections |
The associated LAB KARS software supports the evaluation of rheological test series, including Bagley and Rabinowitsch corrections. This allows measurement data not only to be recorded but also to be processed for more advanced rheological evaluation.
Further information on the instruments is available under Dynisco capillary rheometers at ICS Schneider.
For applications in which melt pressure is to be measured directly in extruders, plastics processing machines or test systems, you will also find a selection of Dynisco melt pressure sensors.
Conclusion
A capillary rheometer can characterize the flow behavior of a polymer melt in considerable detail. Correct interpretation of the measured values is, however, essential.
Capillary diameter, L/D ratio, pressure measuring point, pressure sensor range, temperature and residence time all directly affect the result. In addition, advanced rheological evaluation must take into account effects such as entrance pressure losses, non-Newtonian flow behavior and wall slip.
The Bagley correction primarily corrects additional entrance pressure losses, while the Rabinowitsch correction accounts for the actual wall shear rate of a non-Newtonian material. A systematic dependency of measured values on capillary diameter can, in turn, indicate wall slip.
Particularly in quality assurance, the following principle therefore applies: a deviating flow curve is initially a measurement observation and not automatically proof of a deviating material batch. Only after geometry, pressure measurement, temperature, time-dependent behavior and evaluation method have been checked can a material difference be assessed reliably.
FAQ: Capillary rheometers, pressure measurement and shear viscosity
What does a capillary rheometer measure?
A capillary rheometer determines the flow behavior of a polymer melt by forcing the material through a capillary at a defined speed. Shear rate, shear stress and shear viscosity, among other quantities, are determined from volumetric flow rate, capillary geometry and pressure or piston force.
What is the difference between apparent and corrected shear viscosity?
Apparent shear viscosity is initially calculated directly from simplified relationships for shear rate and shear stress. Corrected values take additional physical effects into account, such as entrance pressure losses and the non-Newtonian velocity profile of the polymer melt.
What does the L/D ratio of a capillary mean?
L/D is the ratio of capillary length L to internal diameter D. It influences the relationship between pressure loss within the capillary and additional pressure losses at the entrance. Different L/D ratios are used, among other things, for Bagley analyses.
Why does capillary diameter have such a strong influence on the measurement?
The diameter enters the calculation of apparent shear rate to the third power. Even small deviations in the actual capillary diameter can therefore have a relevant influence on the calculated result.
What is the Bagley correction?
The Bagley correction is used to separate additional pressure losses at the capillary entrance from the pressure component attributable to the actual capillary flow. This is typically done by comparing capillaries with the same diameter but different L/D ratios.
What does the Rabinowitsch correction correct?
The Rabinowitsch correction accounts for the fact that a polymer melt is normally not a Newtonian fluid. As a result, the actual shear rate at the capillary wall differs from the initially calculated apparent shear rate.
Are both the Bagley and Rabinowitsch corrections required?
This depends on the type of evaluation required. The two methods correct different effects: Bagley mainly addresses additional pressure losses, whereas Rabinowitsch addresses the non-Newtonian flow profile. Both corrections may therefore be relevant for advanced rheological characterization.
What is wall slip in a capillary rheometer?
In wall slip, the polymer melt moves relative to the capillary wall. The conventional assumption of zero velocity directly at the wall is therefore no longer valid. This can cause the apparent viscosity to appear lower than it would without wall slip.
How can wall slip be detected?
A typical approach is to compare flow curves recorded using different capillary diameters. If a systematic dependency on capillary radius is observed at the same wall shear stress, a Mooney analysis can be used to determine or estimate the slip velocity.
Why is the pressure sensor range important in a capillary rheometer?
If the measuring range is considerably larger than the actual pressure, only a small portion of the range is used at low pressures. Zero-point errors and other uncertainty contributions may therefore become relatively more significant. At the same time, the measuring range must be large enough to prevent overload at high shear rates.
Why must a melt pressure sensor be checked at test temperature?
The zero point of a melt pressure sensor can shift during heating. The sensor should therefore be checked after sufficient thermal stabilization at the intended test temperature and, where required, zeroed in accordance with the instrument instructions.
Why does viscosity change during a measurement?
A change over time may indicate thermal or hydrolytic degradation, oxidation, crosslinking or other material reactions. For sensitive materials, a time sweep can therefore be useful before performing a complete shear-rate measurement.
What is the difference between the LCR7000, LCR7001 and LCR7002?
The LCR7000 uses a single measuring barrel and force measurement via a load cell. With the LCR7001, force measurement and/or direct pressure measurement can be used with a single measuring barrel. The LCR7002 features two measuring barrels with two pressure sensors and therefore enables twin-die measurements, which are useful, for example, when comparing different capillary geometries.
When are capillary rheometer measurements truly comparable?
Measurements are only reliably comparable when material preparation, temperature, residence time, capillary geometry, pressure measurement, shear-rate range and evaluation method are sufficiently consistent. Particularly for batch comparisons, these conditions should be clearly defined in the test procedure.