


Pressure transmitters, temperature transmitters, level sensors and flowmeters frequently provide their measured values as standard analogue signals. The most common signals are 4–20 mA and 0–10 V. If a process is only to be monitored temporarily or a sporadic fault is to be investigated, a data logger can be used in parallel with or in addition to the existing PLC.
The electrical connection must not be made solely on the basis of the signal designation. In a 4–20 mA current loop, the power supply, current flow, load and installation position of the logger must be compatible. With a 0–10 V signal, however, the input impedance, common reference potential and voltage drops are particularly important.
The subsequent scaling also determines how meaningful the recording is. A logger may, for example, measure 12.00 mA correctly, but it will only display the correct process value if the sensor’s start value, end value, unit and characteristic curve have been entered correctly.
This article explains how analogue sensor signals can be recorded safely, converted into physical values and compared with the indications of a PLC or process control system.
Table of contents
- When a separate data logger is useful
- Comparison of 4–20 mA and 0–10 V
- How a 4–20 mA current loop works
- How a 0–10 V signal is connected
- Correctly assigning the sensor supply and logger input
- Checking the load and available loop voltage
- Additionally recording an existing PLC signal
- Scaling the signal to pressure, temperature or flow
- Defining the measuring interval and recording duration
- Comparing the logger and PLC
- Systematically isolating typical faults
- Practical example: Recording pressure fluctuations at a pump
- Which measuring instruments / products are suitable?
- Conclusion
- Frequently asked questions about analogue sensor signals and data loggers
When a separate data logger is useful
Many installations already have a PLC or process control system. Nevertheless, an additional data logger can be useful if the existing controller does not provide an adequate recording function or access to the control program is not possible.
Typical applications include:
- sporadic fluctuations in pressure, temperature or flow
- comparison of a sensor signal with the PLC display
- temporary process monitoring during commissioning
- recording before and after a system modification
- investigation of pump, valve or machine cycles
- documentation of a complaint or plant shutdown
The logger should record the actual operating condition wherever possible without significantly altering the existing measuring chain. Whether this is possible depends largely on whether a current or voltage signal is present.
Comparison of 4–20 mA and 0–10 V
| Property | 4–20 mA | 0–10 V |
|---|---|---|
| Transmission method | Current signal | Voltage signal |
| Typical sensor connection | Frequently two-wire technology | Frequently three- or four-wire technology |
| Cable run | Well suited to longer cable runs | More suitable for short to medium cable runs |
| Cable resistance | Causes a voltage drop as long as sufficient loop voltage is available | Can directly influence the measured value |
| Wire-break detection | Generally easy to detect because of the live zero | 0 V can mean a measured value, wire break or loss of power |
| Additional logger | Connected in series or via galvanically isolated signal splitting | Frequently possible in parallel with a sufficiently high-impedance input |
The 4–20 mA signal has what is known as a live zero. With a measuring range of 0 to 10 bar, 4 mA corresponds to the lower range value of 0 bar and 20 mA to the upper range value of 10 bar.
Depending on the sensor, values significantly below 4 mA or above 20 mA may indicate under-range, over-range or an instrument fault. Values of approximately 3.6 mA and 21 mA are frequently used as diagnostic limits, for example. However, the exact values must be taken from the data sheet of the respective transmitter.
With 0–10 V, 0 V normally corresponds to the lower range value and 10 V to the upper range value. An interrupted cable can also result in 0 V and therefore cannot be distinguished clearly from a genuine zero reading. Variants such as 2–10 V or 1–5 V also provide a live zero.
How a 4–20 mA current loop works
In a typical two-wire transmitter, the same two conductors are used both to supply power to the sensor and to transmit the measuring signal.
A simple loop consists of:
- 24 V DC power supply
- two-wire transmitter
- analogue input of the PLC or data logger
- connecting cables and, where applicable, overvoltage protection
All components are connected in series. The same current therefore flows through the transmitter, logger or PLC input and the connecting cables.
A current input must not be connected arbitrarily in parallel with an existing loop in the same way as a voltage input. This could split the current, short-circuit the loop or completely distort the measurement.
If the logger is to measure the loop current directly, its mA input is normally inserted in series. The loop must be opened for this purpose. During the work, the PLC may detect a loss of the measured value or a fault condition. The installation should therefore be planned and carried out only by qualified personnel.
How a 0–10 V signal is connected
With a voltage signal, the sensor generates an output voltage between the signal terminal and the reference potential. A data logger measures this voltage using an input with the highest possible impedance.
A 0–10 V input can frequently be connected in parallel with the existing PLC input. Both inputs are then connected to the same sensor output.
The prerequisites are:
- sufficiently high input impedance of both evaluation devices
- permissible total load on the sensor output
- common and clearly routed reference potential
- no impermissible galvanic connection between plant sections
Potential differences between the ground connection of the data logger and the PLC are particularly critical. These can cause equalising currents, measuring deviations or, in the worst case, damage.
For long cable runs, different control cabinets or widely separated plant sections, a galvanically isolated input or isolating amplifier is often preferable to a direct parallel connection.
Correctly assigning the sensor supply and logger input
Before connection, it must be checked whether the data logger only measures the signal or also provides a power supply for the sensor.
Passive mA input
A passive current input measures the existing loop current but does not provide a supply voltage. The transmitter therefore requires an external power supply.
Logger with loop power supply
Some instruments can directly supply a two-wire transmitter with 24 V DC, for example, while measuring the current at the same time. This simplifies temporary measuring setups in which an existing PLC loop is not to be used.
0–10 V sensor
A voltage-output sensor frequently requires three connections:
- supply voltage
- reference potential or ground
- signal output
The sensor supply must not be confused with the signal input of the logger. A sensor with a 24 V DC supply and a 0–10 V output requires a logger that measures 0–10 V, not a 24 V input.
The sensor data sheet and wiring diagram should therefore be checked before wiring. The pin assignment, supply voltage, output signal and permissible load are particularly important.
Checking the load and available loop voltage
Every current input causes a voltage drop in the 4–20 mA loop. This electrical resistance is known as the load.
The power supply must be sufficient to cover the following voltage components:
- minimum operating voltage of the transmitter
- voltage drop across the PLC input
- voltage drop across the additional logger input
- cable resistance
- overvoltage-protection and isolation modules
In simplified form:
Maximum total load = (supply voltage − required transmitter voltage) ÷ maximum loop current
Example:
- supply: 24 V DC
- required minimum voltage of the transmitter: 10 V
- maximum current: 20 mA
The maximum available load for the inputs, cable and additional components is therefore:
(24 V − 10 V) ÷ 0.02 A = 700 Ω
If the PLC input already has a resistance of 250 Ω and the additional logger has a further 250 Ω, for example, 200 Ω remain for the cable and other components.
If the total load is too high, the transmitter may no longer be able to drive the required current, particularly in the upper part of the measuring range. The recording may then remain at a certain value or show an increasing deviation as the process value rises.
Additionally recording an existing PLC signal
For comparison with a running PLC, the logger must be integrated in such a way that the existing measurement remains as unaffected as possible.
Measuring 4–20 mA in series
The logger input is connected in series with the existing current loop. It therefore measures the same current as the PLC. The additional load, supply voltage and effects of interrupting the loop during connection must be checked.
Using a signal isolator or signal splitter
An active signal isolator can generate two galvanically isolated output signals from one input signal. One output supplies the PLC, while the second supplies the data logger.
This solution is particularly useful when:
- the PLC loop must not be opened
- galvanic isolation is required
- different reference potentials are present
- a permanent second evaluation channel is required
Measuring the voltage across the existing input resistor
If the loop current is already evaluated using a known resistor, the voltage drop across this resistor can be measured under certain conditions. With 250 Ω, for example:
- 4 mA = 1 V
- 12 mA = 3 V
- 20 mA = 5 V
This method requires the resistance value, reference potential and galvanic conditions to be clearly known. It should not be used without checking the circuit diagram.
Recording 0–10 V in parallel
A high-impedance voltage input can usually be connected in parallel with the PLC input. However, the total load must not overload the sensor output. The ground routing and equipotential bonding must also be correct.
Scaling the signal to pressure, temperature or flow
The logger initially measures only milliamperes or volts. For meaningful evaluation, the electrical signal must be converted into the physical measured quantity.
Linear scaling of 4–20 mA
For a sensor with a linear output:
Measured value = lower range value + ((current − 4 mA) ÷ 16 mA) × measuring span
Example for a pressure sensor from −1 to +9 bar:
- lower range value: −1 bar
- upper range value: +9 bar
- measuring span: 10 bar
- measured current: 12 mA
The calculation is:
−1 bar + ((12 mA − 4 mA) ÷ 16 mA) × 10 bar = 4 bar
Linear scaling of 0–10 V
For a linear 0–10 V signal:
Measured value = lower range value + (voltage ÷ 10 V) × measuring span
A temperature sensor with 0–10 V for −50 to +150 °C provides the following value at 7.5 V:
−50 °C + (7.5 V ÷ 10 V) × 200 °C = 100 °C
At least the following information must therefore be entered in the logger:
- electrical lower value
- electrical upper value
- physical lower range value
- physical upper range value
- unit
- number of decimal places
For flow measurements, the output may be linear with the flow or, depending on the instrument, square-root extracted or otherwise scaled. The characteristic curve must not be assumed to be linear without checking it.
Defining the measuring interval and recording duration
The measuring interval must match the speed of the process. A temperature change in a large tank may be slow, while pressure peaks caused by a switching valve may last only a few milliseconds.
As a practical guide, the shortest relevant event should be captured by several measured values. If a pressure fluctuation lasting five seconds is to be detected, a measuring interval of one minute is unsuitable.
| Application | Typical approach |
|---|---|
| Slow room or tank temperature | Approximately 10 seconds to several minutes |
| Pump and valve cycles | Approximately 100 milliseconds to a few seconds |
| Machine or hydraulic processes | Milliseconds to seconds depending on the dynamics |
| Very fast pressure peaks | High-speed logger and suitable sensor required |
In addition to the sampling rate, the storage capacity and data evaluation must be considered. An extremely short measuring interval produces large amounts of data and is not automatically useful if the sensor itself responds only slowly.
Comparing the logger and PLC
If the logger and PLC display different values, a defective sensor should not be assumed immediately. The comparison must be made at the same level.
It is useful to document the following simultaneously:
- raw electrical signal at the logger
- scaled process value at the logger
- raw value or diagnostic value in the PLC
- displayed PLC process value
- timestamp and operating condition
Typical causes of deviations include:
- different measuring-range scaling
- incorrect unit, for example bar instead of kPa
- different filter or averaging times
- different sampling rates
- offset or gain error of an analogue input
- voltage drop or load problem
- incorrect timestamp
A PLC may, for example, measure internally once per second but display only a smoothed average over 30 seconds. A fast logger will then show significantly more fluctuations even though both instruments receive the same input signal.
Systematically isolating typical faults
| Fault symptom | Possible cause | Test |
|---|---|---|
| Logger always displays 0 mA | Current input connected in parallel instead of in series, or loop interrupted | Check the wiring and current path |
| Measured value does not reach the upper range value | Total load too high or supply voltage too low | Measure the voltage at the transmitter at 20 mA |
| Logger and PLC differ by a constant amount | Different scaling or zero-point offset | Compare the 4, 12 and 20 mA points |
| 0–10 V signal fluctuates after connecting the logger | Input impedance too low or grounding problem | Check the output load and reference potentials |
| Value fluctuates while the frequency converter is running | EMC interference or incorrect shielding | Check the cable routing, shielding and galvanic isolation |
| Logger displays the correct mA value but the wrong unit | Incorrect scaling configured in the logger | Check the sensor lower value, upper value and unit |
| Value remains at approximately 3.6 or 21 mA | Diagnostic signal from the transmitter | Check the sensor status, power supply and process connection |
For clear fault diagnosis, the measuring chain should be checked section by section: first the sensor supply, then the output signal, cable, logger input and finally the scaling or software evaluation.
Practical example: Recording pressure fluctuations at a pump
Sporadic fault shutdowns occur at a delivery pump. During normal operation, the PLC indicates a pressure of approximately 6 bar. No abnormal events are visible in the existing trend because of the slow recording rate.
The installed pressure transmitter has a measuring range of 0 to 10 bar and a two-wire output of 4–20 mA. The data logger is inserted in series into the existing loop.
Before connection, the following are checked:
- 24 V DC loop power supply
- load of the PLC input
- additional load of the logger
- minimum operating voltage of the transmitter
- correct polarity
The scaling 4 mA = 0 bar and 20 mA = 10 bar is configured in the logger. A measuring interval of 100 milliseconds is selected.
During normal operation, the recording shows approximately 13.6 mA or 6 bar. Immediately before the fault shutdown, the signal falls to approximately 7.2 mA for less than two seconds. This corresponds to approximately 2 bar.
The rapid pressure drop was not visible in the previous PLC trend because only a smoothed value was stored at longer intervals.
For a plausibility check, a loop calibrator is then used to supply signals of 4, 12 and 20 mA. The logger and PLC display matching values at these points. Scaling and input faults can therefore largely be ruled out.
The subsequent investigation then focuses on the pump, suction line and valve control. The example shows that an additional data logger not only documents measured values, but also helps to distinguish between electrical and process-related faults.
Which measuring instruments / products are suitable?
The multifunction measuring instruments used as data loggers category contains mobile and stationary systems for recording analogue sensor signals, frequencies, pulses and other process variables.
MultiSystem 4070 for mobile service and diagnostic measurements
The MultiSystem 4070 is a mobile handheld measuring instrument with five measuring inputs. It supports, among other signals:
- 0/4–20 mA
- 0/2–10 V
- 1–5 V
- 0.5–4.5 V
- ±10 V
- frequency and pulse signals
Up to 100 measuring series, each containing a maximum of two million measured values, can be stored. The instrument is particularly suitable for temporary measurements on machinery, hydraulic power units and industrial sensors.
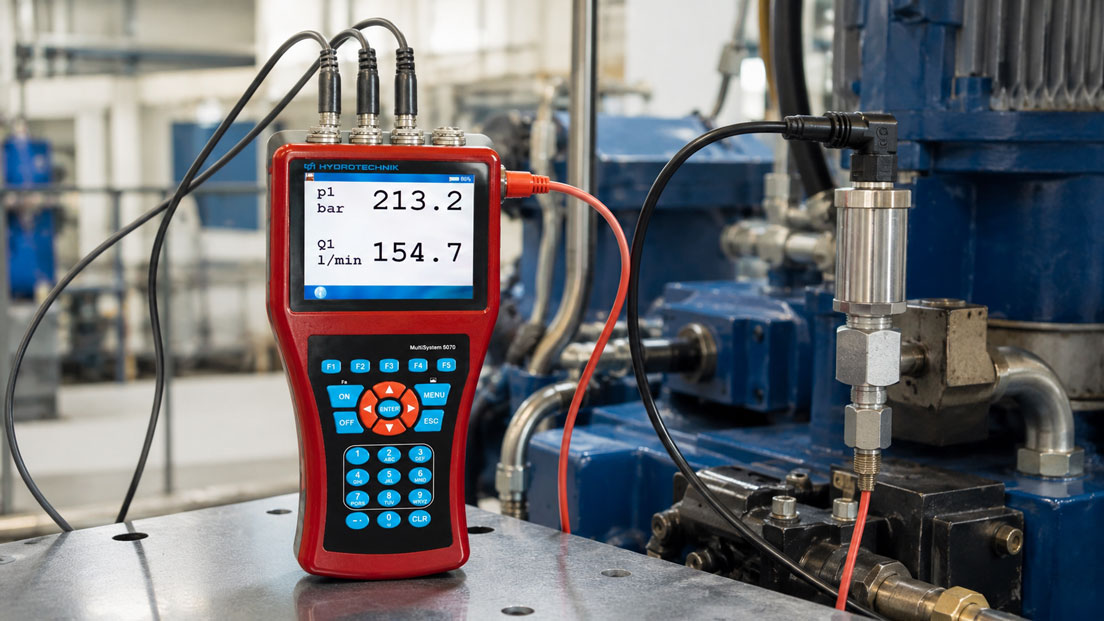
MultiSystem 5070 for multiple signals and fast processes
The MultiSystem 5070 has six analogue measuring inputs and additional calculation or CAN channels.
It supports the same common current and voltage signals and achieves a sampling rate of up to 10 kHz. It is therefore also suitable for more dynamic processes and the simultaneous recording of several sensors.
Up to 500 measuring series with a maximum of six million measured values per series enable extensive long-term and comparative measurements.
UPS4E for testing the 4–20 mA measuring chain
The UPS4E loop calibrator is a useful addition to data recording.
It can measure and source 0 to 24 mA, supply a passive current loop with 24 V DC and simulate defined signals for testing the data logger, PLC input and scaling.
With its integrated recording function for up to 100,000 measured values, it can also be used for targeted diagnostic recordings directly within a 4–20 mA current loop. A multifunction data logger is more suitable for the simultaneous recording of several sensors or additional voltage signals.
ICS Schneider Messtechnik assists with selecting the input channels, signal type, sensor supply, sampling rate and storage capacity. The required information includes the number of sensors, output signals, power supply, measuring ranges, process dynamics, required recording duration and existing PLC connection.
Conclusion: Signal type, power supply and scaling must be considered together
A data logger can record analogue sensor signals independently of an existing PLC and thereby reveal sporadic process problems. The prerequisite is an electrical connection that is suitable for the signal type.
A 4–20 mA input is normally connected in series within the current loop. The loop power supply and additional load must be checked. A high-impedance 0–10 V input can frequently be connected in parallel, provided that the reference potential and output load are suitable.
The measured current or voltage must then be scaled correctly to the physical measured quantity. Incorrect lower and upper values can produce process values that appear plausible but are technically incorrect.
For a reliable comparison with the PLC, the measuring interval, filtering and timestamps must also be considered. Different recording and averaging times can cause significant deviations even though both instruments measure the same signal.
A multifunction data logger is particularly useful when several sensors or fast process sequences are to be recorded. A loop calibrator supplements the measurement by providing defined 4–20 mA signals for testing the logger, cable and PLC.
Frequently asked questions about analogue sensor signals and data loggers
Can a 4–20 mA logger be connected in parallel with the PLC input?
Normally, a direct mA input cannot be connected in parallel. It must be connected in series or integrated using a suitable signal isolator or signal splitter.
Can a 0–10 V logger measure in parallel with the PLC?
This is frequently possible with a sufficiently high-impedance input. However, the output load, common reference potential and possible ground loops must be checked.
Does a two-wire transmitter require its own power supply?
Yes. The current loop requires a voltage source. This can be provided by a power supply unit, the PLC or a suitably equipped logger or calibrator.
What does load mean in a 4–20 mA signal?
The load is the electrical resistance of the inputs, cables and protective components connected in series. If the total load is too high, the transmitter cannot output the complete current range.
How is a 4–20 mA signal scaled to a process value?
4 mA is assigned to the lower range value and 20 mA to the upper range value. With a linear sensor, proportional conversion is performed between these points.
Why does the PLC display a more stable value than the data logger?
The PLC may use stronger filtering or a longer averaging period. Different measuring intervals and storage intervals can also change the displayed result.
Can a data logger record fast pressure peaks?
Only if the sensor, input and sampling rate are sufficiently fast. A slow sensor or long measuring interval cannot record short peaks correctly.
How can the scaling of a logger be checked?
A loop or process calibrator can be used to supply defined values such as 4, 12 and 20 mA and compare them with the displayed physical quantity.
Which information does ICS Schneider require for selecting the instrument?
The required information includes the number and type of signals, sensor supply, measuring ranges, required units, process speed, recording duration, storage rate and the planned integration into an existing PLC measuring chain.