


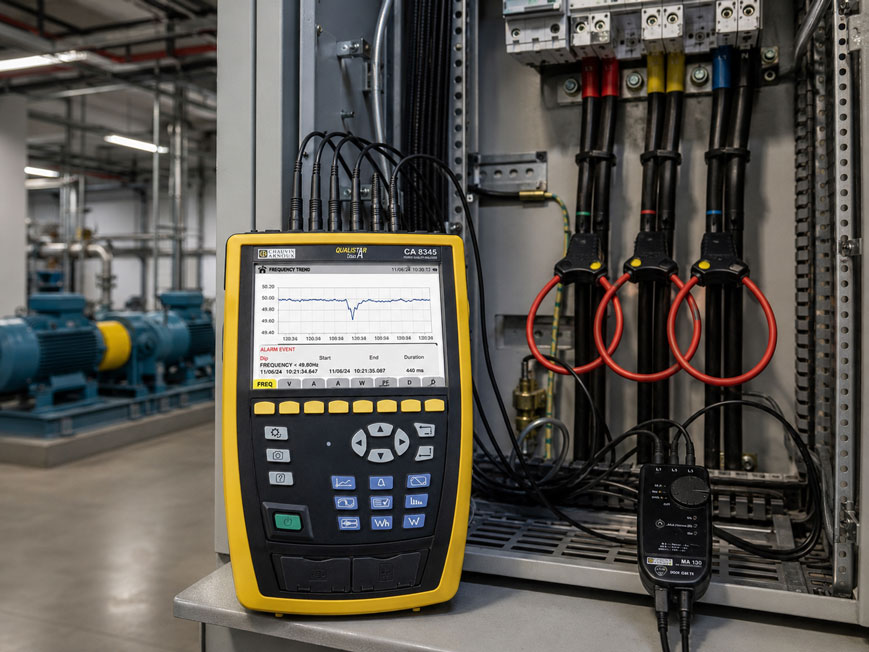
A production plant sporadically reports:
Frequency fault
or:
Mains outside tolerance
However, during a later inspection, the multimeter once again shows:
50.00 Hz
This does not yet prove that there was no mains problem. Short underfrequency or overfrequency events may already have ended long before a technician arrives at the plant.
For troubleshooting, the mains frequency must therefore not only be measured instantaneously, but recorded over a sufficiently long period of time. The following are particularly important:
- frequency trend,
- underfrequency and overfrequency limits,
- event duration,
- timestamp,
- simultaneous voltage and current changes.
A single frequency reading only answers the question of how high the mains frequency is at the moment of measurement. For sporadic faults, however, a power quality recorder is required that stores trends and limit violations with timestamps.
A particularly suitable device from the ICS portfolio is the Chauvin Arnoux CA 8345 Power Quality Analyzer. The power quality analyzer complies with IEC 61000-4-30 Edition 3 Class A, offers trend recording and configurable alarms, and provides a monitoring mode for investigations in accordance with EN 50160.
Further devices can be found under Electrical Measuring and Test Equipment at ICS Schneider.
Table of Contents
- What does mains frequency indicate?
- Why does frequency change at all?
- What does underfrequency mean?
- What does overfrequency mean?
- Which frequency limits apply?
- Distinguishing instantaneous value, trend and event
- How short frequency events are recorded
- Setting trigger, hysteresis and minimum duration correctly
- Why the timestamp is crucial
- Do not consider frequency in isolation
- Detecting load changes using current measurement
- Where should the power quality analyzer be connected?
- Island grids and generator operation
- UPS and standby power systems
- Frequency event or transient?
- How long should the recording run?
- Practical example: sporadic frequency alarm
- Typical errors in frequency monitoring
- Recommended measurement procedure
- Suitable power quality measurement equipment from ICS Schneider
- Conclusion
- FAQ
What does mains frequency indicate?
In the European interconnected grid, the nominal frequency is:
50 Hz
A complete electrical cycle therefore lasts:
T = 1 / f = 1 / 50 Hz = 20 ms
Frequency is not merely a property of the applied voltage. In a synchronously operated AC grid, it is closely linked to the balance between:
generated active power
and:
consumed active power
.
In simplified terms
If the load suddenly increases more strongly than generation, the frequency tends to decrease.
If, on the other hand, there is temporarily more generation than load, the frequency may rise.
Mains frequency is therefore an important indicator of the instantaneous active power balance within an AC power system.
Why does frequency change at all?
A frequency of exactly:
50.000 Hz
at every moment is not to be expected in a real power system.
Small deviations occur continuously due to changes in:
- consumer load,
- generation output,
- grid interconnections,
- generator control,
- energy storage systems,
- renewable generation.
In a large interconnected grid
the frequency is normally relatively stable due to the large interconnected generation and grid structure.
In a small island grid
a single large consumer can already have a significant influence.
Example:
A generator supplies:
100 kW load
and a large additional motor is suddenly switched on.
Until the generator speed or power control system responds, the frequency may temporarily fall.
What does underfrequency mean?
Underfrequency occurs when the measured mains frequency falls below a defined lower limit.
For example:
f < 49.5 Hz
Whether this limit already represents an impermissible condition depends, however, on:
- grid type,
- applicable standard,
- grid operator,
- plant requirements,
- generator control,
- protection settings.
Possible causes of underfrequency
- sudden increase in load,
- loss of generation capacity,
- generator governor responding too slowly,
- overloading of an island grid,
- switching operations between mains and generator,
- synchronisation problems.
Possible effects
Sensitive systems may respond to underfrequency by:
- issuing warnings,
- switching to backup supply,
- shedding loads,
- shutting down drives,
- triggering protection functions.
What does overfrequency mean?
Overfrequency occurs when an upper limit is exceeded.
For example:
f > 50.5 Hz
Possible causes
- sudden load shedding,
- excessive generator output,
- control problems in an island grid,
- switching operations,
- faulty generator speed control.
Typical example
A diesel generator supplies several large consumers.
If a significant proportion of the load is suddenly switched off, the mechanical drive power initially remains available.
The generator speed may briefly increase.
As a result, the electrical frequency also rises until the speed governor reduces the power.
Which frequency limits apply?
There is no single frequency limit that may be applied to every industrial application.
A distinction must be made in particular between:
- quality characteristics of the public supply network,
- protection limits of a plant,
- generator limits,
- UPS limits,
- grid connection requirements,
- customer-specific operating limits.
EN 50160 as guidance for public networks
For a 50 Hz supply network operated synchronously with an interconnected system, the following ranges are frequently used in connection with EN 50160:
| Frequency range | Reference |
|---|---|
| 49.5 … 50.5 Hz | 50 Hz ±1% |
| 47 … 52 Hz | extended frequency range |
The narrower range should not be interpreted as an immediate shutdown limit for an individual item of equipment.
Protection, alarm or shutdown limits must always be based on the specific grid connection conditions, equipment requirements and protection concept that apply.
An alarm may therefore deliberately be set more tightly
For troubleshooting purposes, for example, the following could be recorded:
Underfrequency alarm < 49.8 Hz
and:
Overfrequency alarm > 50.2 Hz
This makes even smaller deviations visible, although they do not automatically represent a non-compliant condition.
Distinguishing instantaneous value, trend and event
When measuring mains frequency, three different types of observation should be distinguished.
1. Instantaneous value
Example:
49.98 Hz
This value only describes the current condition.
2. Trend recording
The frequency value is stored continuously over time.
This may produce, for example:
50.01 → 50.00 → 49.96 → 49.82 → 49.71 → 49.89 → 49.99 Hz
This makes the progression and dynamics visible.
3. Limit or alarm event
The measuring instrument specifically records that:
f < defined limit
or:
f > defined limit
occurred.
At a minimum, the following should also be stored:
- start,
- end,
- duration,
- minimum or maximum value,
- timestamp.
How short frequency events are recorded
A common mistake is to store only long-term average values.
Assume the following trend occurs within a measuring interval:
50.00 Hz → 49.55 Hz → 50.00 Hz
and the deviation lasts only a few seconds.
An average calculated over a long period may still be almost:
50.00 Hz
.
The actual event would therefore be practically invisible.
This is why limit alarms are important
The recorder continuously monitors the frequency and stores the event immediately when the configured condition is exceeded.
For sporadic faults, event recording is usually more informative than a single daily, hourly or minute average.
Setting trigger, hysteresis and minimum duration correctly
A limit value alone is not always sufficient.
Example
The alarm is set to:
f < 49.8 Hz
However, the frequency continuously fluctuates between:
49.79 and 49.81 Hz
Without suitable hysteresis, the measuring instrument could continuously start and end new events.
Hysteresis prevents this chattering
For example:
Alarm ON below 49.80 Hz
Alarm OFF only above 49.85 Hz
A minimum duration may also be useful
For example:
f < 49.8 Hz for at least 1 s
This filters out very short deviations if they are not relevant to the specific application.
The limit, hysteresis and minimum duration must be appropriate for the problem being investigated. If they are set too generously, the event may not be recorded. If they are set too sensitively, an unnecessarily large number of events may be generated.
Why the timestamp is crucial
A frequency event becomes particularly valuable when it can be correlated with other plant information.
Example
Power quality recorder:
14:37:22.4 → minimum frequency 49.62 Hz
PLC event log:
14:37:22 → compressor 3 started
Generator control:
14:37:22 → load step detected
This creates a plausible correlation.
When several measuring instruments are used
a common time base is particularly important.
Internal GPS synchronisation or precise network time synchronisation makes it easier to correlate events from:
- power quality analyzer,
- protection relay,
- PLC,
- UPS,
- generator control,
- control system.
Do not consider frequency in isolation
When troubleshooting, the frequency should preferably be recorded together with other mains parameters.
Particularly useful parameters include:
- voltage L1/L2/L3,
- current L1/L2/L3,
- active power,
- reactive power,
- unbalance,
- voltage dips and interruptions.
Example
A frequency dip occurs at the same time as:
strongly increasing current
and:
falling voltage
.
This is more likely to indicate a significant load step or weak supply than a pure frequency-control deviation.
Another example
The frequency remains stable while the voltage drops sharply for a short period.
In this case, the primary problem is probably not frequency-related.
Power quality therefore means analysing events in context rather than considering only one measurement channel.
Detecting load changes using current measurement
For pure frequency determination, a power quality analyzer primarily requires a suitable voltage signal.
For root-cause analysis, however, additional current measurement is often crucial.
Example
Before an event:
I = 120 A
Immediately afterwards:
I = 310 A
and at the same time:
f = 50.0 Hz → 49.6 Hz
This makes a load step apparent as a possible cause.
Without current recording, only the frequency deviation would be visible.
Where should the power quality analyzer be connected?
The measuring point must suit the question being investigated.
For a general assessment of the supply
the:
point of common coupling / PCC
is often particularly suitable.
This makes it possible to assess the power quality actually entering the plant.
For a local problem
additional measurements can be made directly at the affected sub-distribution board or machine.
Example
Measurement at the PCC:
50.00 Hz stable
Measurement downstream of a standby power system:
48.9 … 51.2 Hz
In this case, the cause is clearly not located in the upstream public grid.
Safe connection
When connecting a power quality analyzer, the following must be suitable for the installation:
- measurement category,
- maximum voltage,
- suitable test leads,
- fuse protection,
- occupational safety requirements.
Island grids and generator operation
Island grids react much more sensitively to load changes than large interconnected grids.
Typical applications
- diesel generators,
- construction-site power supplies,
- ships,
- offshore installations,
- microgrids,
- emergency power networks.
Frequency here is strongly influenced by:
- generator output,
- rotating mass,
- speed control,
- load dynamics.
When a large motor starts
the frequency may initially fall and then stabilise again.
For assessment, not only:
fmin
but also:
- event duration,
- control response time,
- overshoot,
- restabilisation
are important.
The limits for an island grid should be derived from the specific generator, plant and protection concept and should not simply be adopted from a public interconnected grid.
UPS and standby power systems
Frequency monitoring also plays an important role in UPS and standby power systems.
Typical sequence
public grid → frequency outside input window → UPS changes operating mode
or:
mains failure → generator starts → frequency stabilises → load is transferred
Relevant measured quantities include
- frequency before switching,
- frequency immediately after switching,
- stabilisation time,
- voltage trend,
- load current,
- interruption duration.
This makes it possible, for example, to distinguish whether a system switches because of an actual mains deviation or because the input window has been configured inappropriately.
Frequency event or transient?
Frequency events and electrical transients are not the same thing.
Frequency event
The period duration or mains frequency changes over several mains cycles or longer.
Transient
A very fast voltage change can instead occur within:
- microseconds,
- fractions of a mains cycle.
Examples include:
- switching surges,
- impulse voltages,
- high-frequency pulses.
A fast voltage pulse is therefore not automatically a frequency event. For a comprehensive power quality investigation, both types of recording may be useful in parallel.
How long should the recording run?
The correct recording duration depends on how often the fault occurs.
Fault occurs several times per day
A recording period of:
24 … 48 hours
may already be sufficient.
Fault occurs only every few days
At least one complete typical operating period should then be recorded.
Difficult-to-reproduce fault
In this case:
several days to one week or longer
may be useful.
For a normative power quality assessment
the observation and evaluation periods specified by the applicable standard or contractual requirement must be observed.
The measurement duration should always be longer than the typical interval between two faults. Otherwise, a fault-free data set may simply mean that the measurement period was too short.
Practical example: sporadic frequency alarm
An industrial plant reports approximately twice per week:
Drive: mains frequency out of range
During manual checks, the frequency is always:
50.00 Hz
Measurement setup
A power quality analyzer is connected at the supply point of the affected sub-distribution board.
The following are recorded:
- frequency,
- voltage L1/L2/L3,
- current L1/L2/L3,
- active power,
- voltage events.
Additional alarm limits for troubleshooting
For example:
Underfrequency < 49.8 Hz
and:
Overfrequency > 50.2 Hz
These values are deliberately used here as sensitive diagnostic limits and not as general normative shutdown limits.
After three days
an event is stored:
10:16:43 – fmin = 49.63 Hz
and at the same time the current rises from:
85 A to 290 A
.
Comparison with the plant control system
At exactly the same time, a large compressor was started directly.
This reveals a correlation between:
load step → grid response → frequency alarm
.
It can now be specifically investigated whether:
- the supply is too weak,
- the generator or transformer is adequately rated,
- a different motor starting strategy is required,
- the frequency limits of the drive are set appropriately.
Typical errors in frequency monitoring
| Observation | Possible cause | Recommended check |
|---|---|---|
| Fault reported, measuring instrument later shows 50.00 Hz | Event has already ended | Use long-term recording with alarm function |
| Trend shows no abnormality | Recording interval too coarse | Activate event or alarm recording |
| Very many short alarms | Limit too tight or no hysteresis | Adjust trigger parameters |
| No alarms despite plant fault | Limit or minimum duration set too generously | Configure trigger more sensitively |
| Frequency event cannot be assigned to a cause | Current and power were not recorded | Record load parameters additionally |
| Timestamps of different systems do not match | Clocks are not synchronised | Use GPS/NTP or a common time base |
| Problem occurs only during generator operation | Island-grid control behaviour | Repeat measurement specifically during generator operation |
| Voltage dip is interpreted as a frequency problem | Measured quantities not evaluated together | Compare voltage event and frequency in time |
| Frequency value implausible during severe voltage disturbance | Reference signal temporarily unsuitable | Check voltage trend and measurement validity |
| Public grid stable, but machine still reports frequency fault | Local supply, UPS or inverter | Compare several measuring points |
| µs voltage pulse is described as a frequency event | Transient and frequency change confused | Use separate transient recording |
Recommended measurement procedure
- Define the fault: When and at which plant does the problem occur?
- Select the measuring point: PCC, sub-distribution board, generator output or directly at the machine.
- Configure the grid system: Set the single-phase or three-phase system and conductor configuration correctly.
- Connect voltage leads: Observe measurement category and occupational safety requirements.
- Add current sensors: If load changes are being investigated as a possible cause.
- Set nominal frequency: For example 50 Hz.
- Activate trend recording: Store frequency and relevant accompanying parameters.
- Define underfrequency limit: Appropriate to the diagnostic task.
- Define overfrequency limit: Also application-specific.
- Set hysteresis: Prevent frequent alarm on/off switching.
- Define minimum duration: Only if very short events are deliberately to be filtered out.
- Synchronise time: Particularly when comparing with PLCs, relays or generator control systems.
- Measure for a sufficiently long period: At least over a typical fault interval.
- Evaluate events: Consider start, duration, minimum and maximum.
- Compare accompanying parameters: Analyse voltage, current and power at the same time.
- Compare plant logs: Take motor starts, switching operations and protection messages into account.
- Confirm the cause: If necessary, carry out a verification measurement after making changes.
Suitable power quality measurement equipment from ICS Schneider
Chauvin Arnoux CA 8345 Power Quality Analyzer
The CA 8345 is particularly suitable for this topic because it is designed as a Class A power quality analyzer for long-term and detailed investigations of electrical networks.
Features particularly relevant to frequency monitoring include:
- IEC 61000-4-30 Edition 3 Class A,
- trend recording of more than 900 parameters,
- configurable alarms,
- up to 20,000 alarm events,
- integrated GPS clock for UTC synchronisation,
- monitoring mode for EN 50160 evaluations,
- SD memory card,
- USB, Ethernet and WLAN,
- PAT3 software for configuration and data evaluation.
Why Class A is useful for comparative measurements
IEC 61000-4-30 defines measurement methods for power quality parameters.
For a Class A instrument, these methods are defined in such a way that measurements from different compliant instruments or measuring locations can be compared more reliably.
This is particularly useful when measurement results are to be:
- compared between several grid points,
- compared with grid operator data,
- used for a formalised power quality investigation.
Combining alarms and trend recording
For troubleshooting, the following combination is particularly useful:
continuous frequency trend + targeted limit alarms
The trend shows the long-term development, while the alarm points directly to the critical moment.
PAT3 for evaluation
With the Power Analyzer Transfer software, recorded data can be:
- transferred,
- displayed graphically,
- evaluated in tables,
- exported.
This allows frequency events to be investigated together with other mains parameters.
Further solutions can be found under Electrical Measuring and Test Equipment at ICS Schneider.
Conclusion
Mains frequency can be displayed instantaneously by many measuring instruments. However, an instantaneous measurement is not sufficient for sporadic underfrequency and overfrequency events.
The frequency trend must be recorded
Only a long-term measurement shows how the frequency changed before, during and after an event.
Limit alarms capture short events
Underfrequency and overfrequency limits make it possible to document deviations with their start, duration and timestamp.
Limits are application-specific
Normative power quality ranges, equipment limits and protection thresholds must not be confused with one another.
Timestamps enable root-cause analysis
Only by correlating the event in time with motor starts, switching operations, protection relays or generator events can a frequency deviation often be turned into a reliable diagnosis.
Current and voltage should also be recorded
This makes it possible to identify whether, for example, a load step, voltage dip or generator control problem occurs at the same time.
Island grids must be assessed separately
Generator and emergency power networks can show much larger and more dynamic frequency changes than a large interconnected grid.
For practical applications
Select measuring point → connect the grid system correctly → activate frequency trend → define underfrequency and overfrequency limits → set hysteresis and event duration appropriately → synchronise the time base → record voltage, current and power in parallel → measure for a sufficiently long period → evaluate events based on minimum, maximum and duration → compare timestamps with plant logs → confirm the cause by means of a verification measurement.
FAQ: Monitoring Mains Frequency Correctly
What is the mains frequency in Germany?
The nominal frequency of the public AC supply network is 50 Hz.
Does the mains frequency always have to be exactly 50.00 Hz?
No. Small frequency deviations are normal in a real power system. The decisive factors are magnitude, duration and the requirements applicable to the particular grid.
What is underfrequency?
Underfrequency occurs when the mains frequency falls below a defined lower limit.
What is overfrequency?
Overfrequency refers to the corresponding exceedance of a defined upper frequency limit.
Why does mains frequency fall?
In simplified terms, frequency can fall when more active power is consumed than generated for a short period. In an island grid, for example, a large load step can cause a significant frequency drop.
Why does mains frequency rise?
One possible cause is a sudden load shedding event in which generation temporarily exceeds the consumed power.
Is 49.9 Hz already a mains fault?
Not automatically. The assessment depends on the grid type, applicable standard, grid operator and plant requirements.
What does the range 49.5 to 50.5 Hz mean?
In a 50 Hz system, it corresponds to a deviation of ±1% and is used in connection with the frequency characteristics of public interconnected networks according to EN 50160.
Can I set 49.8 Hz as an alarm limit?
Yes, if this is useful for diagnostic purposes. However, such an alarm threshold is not automatically a normative shutdown limit.
Why is a multimeter often insufficient for sporadic frequency faults?
It primarily displays the current value. An event that occurred several minutes or hours earlier can no longer be reconstructed with it.
What is frequency trend recording?
Frequency values are continuously stored over a longer period so that the time-dependent trend can subsequently be analysed.
What is a frequency event?
An event occurs, for example, when a configured underfrequency or overfrequency limit is violated under the defined condition.
Why do I need a timestamp?
It allows the frequency event to be correlated with plant messages, motor starts, protection relays, UPS systems or generator controls.
What is the benefit of GPS synchronisation?
It provides a precise common time base and makes it easier to compare events at different measuring points or between different instruments.
Why should current also be measured?
A significant current change occurring at the same time may indicate that a load step is related to the frequency event.
Should voltage also be recorded?
Yes. This makes it possible to determine whether a voltage dip, interruption or another power quality event occurs at the same time.
Where should I measure mains frequency?
For assessing the general supply, the point of common coupling or PCC is often suitable. For local problems, additional measurements should be carried out close to the affected consumer.
Can the frequency downstream of a UPS differ from the mains frequency?
Yes. Depending on the operating state and UPS technology, the output frequency may be generated or regulated by the UPS itself.
Why does a generator frequency fluctuate more strongly?
A small generator network has lower overall power and therefore reacts more strongly to rapid load changes. The dynamics of the speed governor also play an important role.
Is a transient the same as a frequency event?
No. A transient is a very fast voltage change. A frequency deviation, on the other hand, describes a change in period duration or mains frequency.
How long should a frequency measurement run?
The measurement duration should at least cover the typical interval between two faults. For rare events, several days or longer may be necessary.
What does IEC 61000-4-30 Class A mean?
The standard defines standardised measurement methods for power quality parameters. Class A is particularly intended for high-quality, comparable and formalised power quality measurements.
Which ICS device is suitable for frequency monitoring?
The Chauvin Arnoux CA 8345 is particularly suitable for trend, alarm and long-term investigations as an IEC 61000-4-30 Class A power quality analyzer.
Can the CA 8345 record alarms?
Yes. The device offers configurable alarms and stores a large number of alarm events.
Can the CA 8345 be used for EN 50160 evaluations?
Yes. A monitoring mode for analysing voltage quality in accordance with EN 50160 is available for the CA 8345.
Does the CA 8345 provide time synchronisation?
Yes. The device has an integrated GPS clock for synchronisation with UTC and additionally supports network time synchronisation.
Can I evaluate the measurement data later on a PC?
Yes. The data can be transferred, graphically displayed and exported using the Power Analyzer Transfer software PAT3, among other options.
Where can I find further devices for mains and power quality measurements?
Further devices can be found under Electrical Measuring and Test Equipment at ICS Schneider.