


Different currents in supposedly identical PV strings are a valuable indication—but not yet a definitive fault diagnosis. The current of a string is influenced not only by defective modules or poor contacts, but also by irradiance, shading, module temperature, orientation and the inverter’s current operating point. Anyone who simply applies a current clamp to one string after another and compares the readings may therefore incorrectly classify an intact string as faulty or overlook an intermittent fault.
This article explains how PV string currents can be measured and evaluated under comparable conditions. It shows which measured variable is suitable for which question, how partial shading and bypass diodes affect the result, and when voltage measurements, thermography or an I–V curve are required to confirm the diagnosis.
Why compare PV string currents?
For strings connected in parallel to an inverter or PV array junction box, comparing the currents provides a quick plausibility check. Strings with the same number and type of modules, the same orientation and similar environmental conditions should deliver similar currents at the same operating point. A significantly different reading may indicate one of the following causes:
- partial shading or heavy soiling of individual modules,
- activated or defective bypass diodes,
- loose, corroded or incompletely connected DC connections,
- damaged cables, modules or cell interconnects,
- tripped string fuses or string fuses that have become highly resistive,
- incorrect string assignment, a different number of modules or reverse polarity,
- different MPPT states or inverter power limiting.
The comparison is particularly useful because it does not require an exact energy yield forecast. It uses the other strings of identical design as the reference. However, this works only when the comparison conditions are known and remain largely stable throughout the measurement.
Distinguishing between operating current, short-circuit current and the I–V curve
“String current” can refer to three different quantities. These measured variables must not be confused during the assessment:
| Measured variable | Measurement condition | Information provided |
|---|---|---|
| Operating current | The string is connected to the inverter and operates at the current MPPT operating point. | Quick comparison during operation; the result depends on irradiance and inverter control. |
| Short-circuit current ISC | The string is short-circuited in a controlled manner using a purpose-designed PV tester. | Functional test and comparison with reference or manufacturer values; only using a suitable test procedure. |
| I–V curve | An I–V curve tracer sweeps through defined current and voltage values. | Shows the curve shape, steps, MPP, power and mismatch; provides the most comprehensive performance diagnosis. |
For quick troubleshooting, a non-contact comparison of the operating currents is a suitable first step. If the results are unusual, measurements of open-circuit voltage, short-circuit current or the I–V curve can follow. IEC 62446-1 describes documentation, commissioning tests and inspection criteria for grid-connected PV systems. The current national implementation, manufacturer specifications and the operational risk assessment always remain authoritative.
When are two strings comparable?
A reliable comparison requires the strings to have the same electrical design and geometry. The module type, number of modules, rated power, orientation, inclination, cable length and wiring must be checked. Strings on different roof surfaces, using different generations of modules or connected to separate MPP trackers do not form a directly comparable group.
Even identical strings can only be compared meaningfully if they receive similar irradiance at the time of measurement. Moving clouds, shadows from buildings, chimneys, vegetation, antennas or dirt can change the values within seconds. Measurements should therefore be taken simultaneously wherever possible. If only one measuring instrument is available, measure the strings in rapid succession while recording the irradiance in parallel. The measurement series must be repeated if cloud cover changes rapidly.
Safety when measuring on the DC side
Caution: PV modules generate voltage when exposed to light. Switching off the inverter does not automatically de-energise the DC cables on the generator side. Work and testing must only be carried out by qualified personnel using an established procedure.
- The measuring instrument, current clamp, test leads and adapters must be suitable for the maximum DC voltage, current, measurement category and operating environment.
- Personal protective equipment must be selected on the basis of the risk assessment and the condition of the installation.
- Connectors or fuse holders must not be disconnected under load unless they are explicitly designed for this purpose and the procedure permits it.
- Before opening a circuit, check the current using a suitable DC measuring instrument.
- Short-circuit current measurements must only be carried out with a purpose-designed PV tester within its specified limits.
- Damaged, wet or thermally abnormal components must not be touched without prior safety measures.
The maintenance standard IEC 62446-2 covers preventive and corrective maintenance, troubleshooting and occupational safety. However, it does not replace local regulations or installation-specific work instructions.
Measuring operating current with a DC current clamp
A DC current clamp allows the current to be measured without opening the string. Correct application is essential:
- Check the system diagram, string identification and measuring point.
- Select a suitable DC current range and zero or demagnetise the clamp in accordance with the manufacturer’s instructions.
- Clamp around only one conductor—either positive or negative. If the outgoing and return conductors are clamped together, their magnetic fields largely cancel each other out.
- Close the clamp jaws completely, position the conductor as centrally as possible and maintain a distance from adjacent live conductors.
- Only read the value once it has stabilised, and document the current direction or sign.
- Measure all comparable strings using the same procedure and at an equivalent measuring point.
For typical string currents, the maximum measuring range is not the only important factor. Resolution, basic accuracy, zero-point drift and interference determine whether small differences can be reliably detected. A 1000 A current clamp may have sufficient voltage rating, but it must still provide the required resolution in the lower current range.
Taking irradiance and temperature into account
To a first approximation, PV current follows irradiance: as irradiance decreases, the available current also falls. Voltage, by contrast, is more strongly affected by cell temperature. A string current should therefore never be assessed without considering the weather and system conditions.
For comparison measurements, a reference cell or suitable irradiance meter is positioned in the plane of the modules. The module temperature, time, cloud conditions and visible shading must also be recorded. Rear-side irradiance may also be relevant for bifacial modules. Current, temperature and irradiance should be measured as synchronously as possible. This is precisely the principle used by specialised PV test systems when converting measured values to standard test conditions.
Systematically evaluating measured values
For a group of identical strings, the median is a robust reference value because it is less strongly influenced by a single outlier than the arithmetic mean. The relative deviation of a string can be expressed as follows:
Relative deviation = (Istring − Imedian) / Imedian × 100%
There is no universally applicable percentage limit for “good” or “faulty”. The permissible deviation depends on the system, measuring method, irradiance stability, instrument uncertainty, manufacturer data and test objective. A two-stage approach is advisable: first flag statistically abnormal strings, then confirm the cause using supplementary measurements.
Where several MPP trackers are used, each electrically equivalent group is evaluated separately. The string number must be clearly assigned to the corresponding input on the PV array junction box or inverter. Incorrectly labelled cables can otherwise appear to be an electrical fault.
Correctly identifying partial shading
In a series-connected string, the weakest element generally determines the available current. If a module or cell area is shaded, the string current may decrease. Depending on the degree of shading, module design and operating point, a bypass diode may conduct and bypass a group of cells. The effect is therefore not always a uniform loss of current.
Typical indications include a time-dependent current drop, a reproducible pattern at a particular position of the sun, steps in the I–V curve or thermal abnormalities on the shaded module or a bypass diode under load. In its research into the operation of partially shaded PV systems, NREL shows that the effect and resulting loss depend on the shading pattern, bypass diodes and system topology. A single current value is therefore insufficient for diagnosis.
How bypass diodes affect current and voltage
Bypass diodes protect shaded cell groups against excessive reverse bias and allow the remainder of the string to continue delivering current. When a cell group is bypassed, its voltage contribution is lost. An active bypass diode therefore often becomes more evident through a reduced string voltage or a step in the I–V curve than through a clearly defined current reduction.
A permanently short-circuited bypass diode can cause a similar voltage reduction. An open or thermally damaged diode, by contrast, can lead to hotspots and a significant loss of power under shaded conditions. Operating current, string voltage, the I–V curve and thermography are therefore combined for the assessment. A diode must not be classified as defective solely on the basis of a different current reading.
Narrowing down contact and connection faults
High contact resistance may be caused by incompletely mated connectors, incompatible combinations of different connector systems, poor crimps, corrosion or loose terminals. Under load, these faults cause a voltage drop and power loss. The string current may fall, but local heating is often the clearer indication.
The inspection begins with a visual check without unnecessarily moving cables under load. The string current and voltage are then compared. Thermography under a sufficiently high and stable load can reveal heated connectors, fuse holders or terminals. Emissivity, reflections, wind and comparable components must be taken into account. Abnormal connections are only opened after a safe isolation and test procedure has been completed.
Checking string fuses and interruptions
A string with an operating current close to zero may be interrupted. Possible causes include a tripped string fuse, an open connector, a broken cable or an incorrect assignment. Before removing a fuse link, it must be established whether reverse currents from strings connected in parallel can occur.
Measuring the current on both sides of a PV array junction box helps to narrow down the fault. Open-circuit voltage alone does not prove that the current path can carry a load: a high-resistance or intermittent connection can show an almost normal voltage when unloaded. After safe isolation, an abnormal fuse or connection is therefore also checked for continuity, contact condition and signs of thermal damage.
Combining current, voltage, thermography and the I–V curve
| Finding | Possible cause | Recommended follow-up measurement |
|---|---|---|
| Current close to zero, voltage plausible | Interruption, fuse, contact fault or inverter state | Check the current path, fuse and connection using a safe procedure |
| Reduced current, similar voltage | Lower irradiance, soiling, partial shading or mismatch | Record irradiance synchronously, perform a visual inspection and measure the I–V curve |
| Voltage reduced by an amount corresponding to a module or module section | Active or short-circuited bypass diode, or incorrect number of modules | Compare open-circuit voltage, the I–V curve and thermography |
| Current fluctuates while irradiance remains unchanged | Intermittent contact, arcing, control state or measurement error | Logging, thermography, connection testing and inverter data |
| Local hotspot at the connector | Increased contact resistance | Check mechanically and electrically after safe isolation |
Combining several independent indications prevents misdiagnosis. An I–V curve is particularly helpful because shading, bypass activation and mismatch can produce characteristic changes in its shape. Thermography supplements the electrical test but does not replace it.
Practical example: One string supplies less current
Twelve identical strings are connected to two identical MPP trackers. Under stable irradiance, eleven operating currents between 9.6 and 9.9 A are measured, while string 7 supplies 7.8 A. Repeating the measurement after another zero adjustment confirms the deviation. The irradiance remains stable throughout the measurement series, and string 7 is located on the same roof surface.
- Plausibility check: The string diagram, number of modules and assignment are checked. A measurement error caused by clamping around both conductors or by incompletely closed jaws is ruled out.
- Visual inspection: A narrow shadow from a roof vent falls across two modules. The pattern corresponds to the position of the sun.
- Voltage comparison: The operating voltage of string 7 is lower than that of the comparison group. This indicates an active bypass path.
- Thermal inspection: Under load, the junction box of an affected module exhibits plausible heating around the bypass diode, but no abnormal connector is identified.
- Confirmation: Once the shadow disappears, the string current approaches that of the comparison group. An I–V curve measurement documents the difference with and without shading.
The example demonstrates that the current comparison identifies the outlier, but only the combination of irradiance, voltage, system geometry and the I–V curve explains the cause.
Documenting measurements traceably
A test report should contain more than just current readings. The following information is recommended:
- system, inverter, MPPT, string number and clearly identified measuring point,
- module type, number of modules, orientation and inclination,
- date, time, irradiance, module temperature and ambient temperature,
- inverter operating state and known limitations,
- measuring instrument, accessories, measuring range and calibration status,
- current, voltage, sign and repeat measurement,
- photographs of shading, soiling or thermal abnormalities,
- assessment, follow-up measurement and corrective action taken.
Repeated measurements at the same point and under similar conditions reveal trends. This makes it easier to identify gradually deteriorating contacts or increasing shading than with a single instantaneous reading.
Common measurement and interpretation errors
- Positive and negative conductors clamped together: The current clamp displays almost zero even though the string is operating.
- No zero adjustment: Offset and drift are interpreted as a string deviation.
- Strings from different MPPTs compared: Different operating points distort the assessment.
- Measurement series during moving cloud cover: Changes in irradiance over time appear to be string faults.
- Open-circuit voltage used as the sole functional test: A high-resistance current path remains undetected.
- Bypass diode diagnosed from the current value: The voltage profile and I–V curve are missing as confirmation.
- Rigid percentage limit applied: Measurement uncertainty, system design and weather are not taken into account.
- Connector disconnected under load: This creates an avoidable risk of arcing and injury.
Suitable measuring instruments
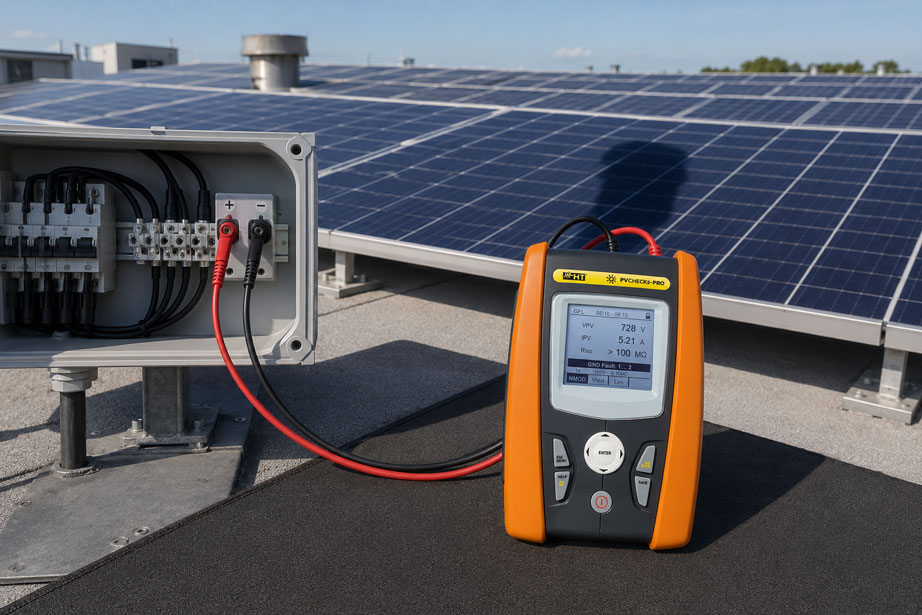
The PVCHECKs-Pro is particularly suitable for functional testing and the direct comparison of PV strings. The instrument available from the ICS shop measures, among other variables, open-circuit voltage up to 1500 V DC and short-circuit current up to 40 A DC. According to the product description, it compares the string currently being measured with previously measured strings and evaluates differences in voltage and current.
If the shape and power of the curve rather than just individual values are to be investigated, an I–V curve tracer such as the I-V500w or the more powerful I-V600 from the current range of PV measuring instruments is suitable. Reliable comparisons also require irradiance to be included in the documentation; the PV204, for example, is available for this purpose.
The selection is based on the maximum string voltage, expected current, required measurement method, measurement category, accuracy, documentation requirements and the system manufacturer’s specifications. The Photovoltaic devices / PV measuring instruments shop category provides an overview.
Conclusion
Comparing PV string currents is a quick and effective way to identify abnormal strings. The comparison only becomes meaningful when identical strings are measured under stable, documented irradiance and at comparable operating points. A DC current clamp provides an initial finding, but not a complete diagnosis.
Partial shading, activated bypass diodes, contact problems and tripped fuses produce different patterns. Current, voltage, visual inspection, thermography and, where necessary, the I–V curve are therefore combined. This turns a simple deviation into technically reliable evidence of a fault.
FAQ: Measuring and evaluating PV string current
How much may the currents of identical PV strings differ?
There is no universal percentage limit. Manufacturer specifications, system design, irradiance stability, operating point and measurement uncertainty are decisive. An abnormal deviation should be confirmed by repeat and follow-up measurements.
Can I measure string current with a conventional current clamp?
Only if it measures direct current and is suitable for the voltage, measurement category, environment and required resolution. The clamp is placed around one conductor and zeroed in accordance with the manufacturer’s instructions before the measurement.
Why does the current clamp display zero even though the string is operating?
Positive and negative conductors have often been clamped together, causing their magnetic fields to cancel each other out. Other possible causes include a missing zero adjustment, an incorrect measurement mode or an actual interruption.
Does a low string current indicate a defective bypass diode?
Not conclusively. An active or short-circuited bypass diode is often more evident from a reduced voltage or a step in the I–V curve. Current, voltage and thermography should be assessed together.
Which is better for comparing strings: operating current or short-circuit current?
The operating current can be compared quickly with a suitable DC current clamp without opening the string, but it depends on the MPPT. Short-circuit current is suitable for defined functional tests, but must only be measured using a suitable PV tester and the prescribed test procedure.
Why must irradiance also be measured?
Because the available PV current is strongly dependent on irradiance. Without synchronous irradiance data, clouds or local shadows can appear to be an electrical string fault.
Can a defective string fuse still show a normal voltage?
Depending on the measuring point and circuit, a plausible open-circuit voltage may be present despite an interrupted load path. The current path, fuse, connection condition and voltage must therefore be checked together.
When is an I–V curve measurement useful?
It is useful when comparing current and voltage does not clearly identify the cause, during commissioning and performance assessment, or when shading, mismatch, cell damage or bypass activation is suspected.