


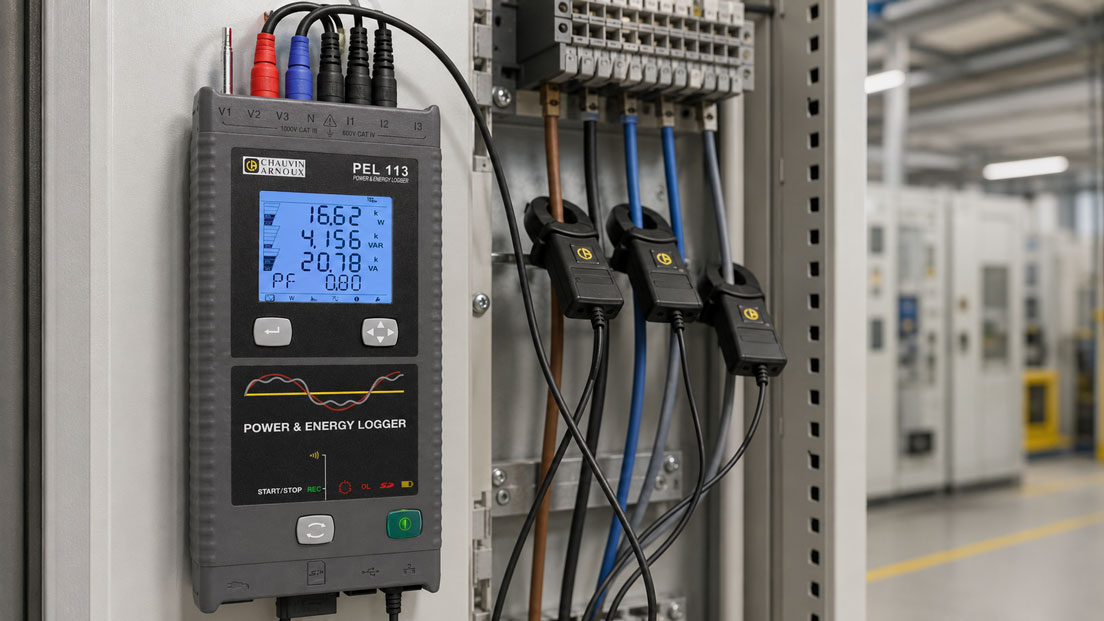
A company’s electricity meter shows how much electrical energy has been consumed in total. However, it does not explain when this consumption occurred, which systems caused the highest power demand or why a conspicuously high base load remains even during periods without production.
A load profile displays electrical power over time. This makes start-up processes, shift changes, production breaks, simultaneously operated major consumers and continuously running auxiliary systems visible. The same measurement can be used to determine energy consumption, recurring load peaks and potential savings.
For a reliable result, measuring current alone is usually not sufficient. A power and energy recorder must measure voltage and current simultaneously and take their phase relationship into account. The correct network configuration, suitable current sensors, a sufficiently long recording period and an appropriately selected logging interval are equally important.
Table of Contents
- What does a load profile show?
- Distinguishing between power, energy, peak load and base load
- Why measuring current alone is not sufficient
- Measuring setup in single-phase and three-phase systems
- Selecting and installing current sensors correctly
- How long should a load profile be recorded?
- Defining the recording interval and averaging period
- Identifying and assessing base load
- Interpreting peak load correctly
- Identifying individual consumers in the load profile
- Considering reactive power and power factor
- Harmonics and non-linear loads
- Evaluating load-profile data systematically
- Deriving potential savings from the load profile
- Typical measurement and interpretation errors
- Safe installation in the control cabinet
- Practical example in a production facility
- Selecting the measuring instrument and current sensors
- Which measuring instruments and products are suitable?
- Conclusion
- Frequently asked questions
What does a load profile show?
A load profile describes the time-dependent progression of the electrical active power of a consumer, machine, sub-distribution board or an entire facility. Time is shown on the horizontal axis, while power in kilowatts is usually shown on the vertical axis.
Depending on the measuring instrument, additional quantities can be recorded simultaneously:
- current and voltage for each phase,
- active, reactive and apparent power,
- active, reactive and apparent energy,
- power factor and cos φ,
- frequency,
- imbalance between the line conductors,
- harmonics and total harmonic distortion, THD,
- minimum, average and maximum values.
The display may cover just a few seconds of a machine start-up or several weeks of complete production operation. Only by combining the time profile with operating information does it become clear which systems require energy at which times.
Distinguishing between power, energy, peak load and base load
| Parameter | Unit | Meaning |
|---|---|---|
| Active power | kW | Instantaneous power or power averaged over an interval that is converted into work, heat or motion |
| Active energy | kWh | Electrical work consumed over a period of time |
| Peak load | kW | Highest power value within a defined evaluation interval |
| Base load | kW | Minimum power that remains continuously or for extended periods |
| Reactive power | kvar | Power component used for electrical and magnetic fields that does not produce usable active work |
| Apparent power | kVA | Total electrical loading consisting of active and reactive power components |
Electrical energy is obtained by integrating active power over time:
E = ∫ P(t) dt
For discrete measured values, the following approximate calculation can be used:
E [kWh] = sum of P [kW] × measuring interval [h]
A system that continuously draws 50 kW for two hours consumes 100 kWh. The same energy consumption can also result from 100 kW over one hour. Both cases may lead to similar energy costs, but they differ significantly in terms of the design of the electrical connection and possible demand charges.
Why measuring current alone is not sufficient
The actual active power can only be estimated approximately from current alone. A simple calculation using the nominal voltage ignores voltage fluctuations, phase displacement, imbalance and distorted current waveforms.
For correct power measurement, voltage and current must be recorded simultaneously. Instantaneous power is calculated as follows:
p(t) = u(t) × i(t)
In a three-phase system, the power values of the individual phases or measuring channels are combined. Each current channel must be assigned to the correct voltage channel.
A current clamp can indicate when a consumer is switched on or off. However, a power and energy recorder with voltage and current inputs is required for a reliable energy and cost analysis.
Measuring setup in single-phase and three-phase systems
Before recording begins, the actual network configuration must be selected in the measuring instrument. Typical configurations include:
- single-phase system,
- three-phase system with neutral conductor,
- three-phase system without neutral conductor,
- unbalanced three-phase system,
- DC or mixed AC/DC application.
In a three-phase system, voltage L1 and current I1 must belong to the same line conductor. The same applies to L2/I2 and L3/I3. If the channels are interchanged, incorrect power factors and implausible active or reactive power values will result.
The following should be checked before the actual measurement starts:
- correct network configuration,
- phase sequence and channel assignment,
- current-sensor range and transformation ratio,
- sign of the active power,
- plausible voltage and current values,
- sufficient memory and secure instrument power supply.
A negative power value may indicate that a current sensor has been installed in the wrong direction. However, it may also be correct if the system is feeding electrical energy back into the network. The sign must therefore be assessed according to the measuring task.
Selecting and installing current sensors correctly
The current sensor largely determines the current range that the measuring instrument can record. Available types include closed current clamps, flexible current loops and AC/DC current sensors.
| Current sensor | Typical strength | Important limitation |
|---|---|---|
| Closed current clamp | Good positioning and a defined magnetic circuit | The conductor must fit inside the clamp opening |
| Flexible current loop | Installation around large conductors, busbars and difficult-to-access points | Usually suitable only for alternating current; correct position and complete loop closure must be ensured |
| AC/DC current clamp | Measurement of AC and DC current components | Zero adjustment and possible sensor drift must be considered |
| Permanently installed current transformer | Permanent sub-metering and energy monitoring | The transformation ratio and secondary-side safety requirements must be observed |
The measuring range should not be unnecessarily large. If a 10 kA sensor is used for a consumer that normally draws 20 A, the signal uses only a very small proportion of the available range. This can reduce resolution and accuracy.
The following points are important during installation:
- enclose only one individual conductor or one individual busbar,
- align the direction of current flow with the sensor marking,
- close the clamp or flexible loop completely,
- consider the distance from adjacent high-current conductors,
- route the current-sensor cables securely,
- document the selected measuring range.
If the outgoing and return conductors are enclosed together, their magnetic fields largely cancel each other out. The measuring instrument then displays an excessively low current or almost zero amperes despite active loads.
How long should a load profile be recorded?
The measuring period must include all operating conditions that are typical for the facility. A short recording during a quiet production phase cannot reliably show the actual peak load or weekend consumption.
| Objective | Appropriate measuring period |
|---|---|
| Start-up behaviour of a single machine | Several complete start-up and operating cycles |
| Consumption of a production system | At least one complete representative production day |
| Shift and weekend behaviour | One complete week or longer |
| Fluctuating order-related or seasonal production | Several weeks or different production phases |
| Verification of an implemented measure | Comparable recording before and after implementation |
The measuring campaign should represent normal production conditions. Company holidays, unusually low utilisation, maintenance shutdowns or exceptional large orders must be identified in the evaluation.
A longer recording is not automatically better if operating events are not documented. A system or shift log makes it considerably easier to assign later load changes to their causes.
Defining the recording interval and averaging period
The recording interval determines how much detail is visible in the changes. An interval of several minutes is suitable for long-term energy profiles but may completely smooth out short start-up peaks.
| Evaluation objective | Typical approach |
|---|---|
| Motor start or short load step | High time resolution down to the second or sub-second range |
| Machine cycle | Recording significantly faster than the shortest relevant section of the cycle |
| Daily and weekly load profile | Condensed average values in the second or minute range |
| Comparison with an energy supplier | Additional evaluation using the contractual demand interval |
A 15-minute average is often used for contractual demand assessment. However, the specific electricity supply contract and the data of the grid or metering operator are decisive.
If 50 kWh are consumed within 15 minutes, this corresponds to an average power of:
P = 50 kWh / 0.25 h = 200 kW
A short motor start-up peak of 400 kW lasting only a few seconds does not necessarily result in a contractual 15-minute peak demand of 400 kW. Nevertheless, it may still be relevant to the electrical loading of the system and possible voltage dips.
Ideally, the instrument should record at a high internal resolution from which different averaging intervals can be generated later.
Identifying and assessing base load
The base load is the power that remains even when no actual production is taking place. It is particularly visible at night, during weekends, breaks and plant shutdowns.
Typical base-load consumers include:
- compressed-air compressors and leakage,
- ventilation and extraction systems,
- refrigeration and cooling-water systems,
- heating systems and trace heating,
- continuously operating pumps,
- servers, network equipment and UPS systems,
- machines in standby mode,
- lighting and building services.
Even a small continuous power demand causes considerable annual energy consumption. A base load of 10 kW corresponds to 240 kWh within 24 hours. The duration is therefore just as important as the power level.
Not every base load can be avoided. Safety systems, frost protection, IT infrastructure or essential cooling may need to operate continuously. Nevertheless, the individual contributions should be known and technically justified.
Interpreting peak load correctly
Peak loads often occur when several major consumers operate simultaneously. Typical causes include:
- simultaneous starting of several machines,
- heating up electric furnaces or dryers,
- compressors operating during high compressed-air demand,
- refrigeration systems under high thermal load,
- electric charging systems,
- pumps and fans without staggered starting.
Three different types of peaks must be distinguished during evaluation:
| Type of peak | Duration | Typical significance |
|---|---|---|
| Very short start-up peak | Milliseconds to seconds | Network loading, protective devices, voltage drop and machine starting |
| Process-related power peak | Seconds to minutes | Machine cycle, heating process or load step |
| Averaged peak load | Contractually defined time interval | Possible relevance to demand charges or electrical connection design |
A measure intended to reduce peak load must be suited to the relevant type of peak. Staggering machine starts can reduce short starting-current peaks. However, it may not reduce a high 15-minute average if all systems subsequently operate at full load at the same time.
Identifying individual consumers in the load profile
A load profile measured at the main distribution board initially shows only the sum of all connected consumers. Individual systems can be narrowed down using characteristic load steps and operating times.
Useful information includes:
- shift and production records,
- machine operating times from the control system,
- targeted switching on and off under safe operating conditions,
- comparison with known connected loads,
- additional measurements at sub-distribution boards,
- temporary sub-metering of major consumers.
An unambiguous conclusion based solely on the curve shape is not always possible. Two machines rated at 30 kW can produce the same load step. A consumer with a connected load of 30 kW may also draw considerably less active power during part-load operation.
For complex facilities, a step-by-step measuring concept is useful: first the main distribution board is recorded, then conspicuous sub-distribution boards and finally individual major consumers are investigated.
Considering reactive power and power factor
Active power describes the energy that is actually converted. However, cables, transformers and switchgear are loaded by the total current and therefore also by reactive and distortion components.
With inductive consumers such as motors and transformers, an unfavourable power factor can result in higher currents. Possible consequences include:
- additional cable losses,
- increased loading of cables and transformers,
- reduced usable connection capacity,
- possible reactive-energy charges, depending on the contract.
A load profile should therefore include not only active power but also reactive power, apparent power and power factor. It should be noted that cos φ and the overall power factor do not necessarily provide the same information when current waveforms are distorted.
Harmonics and non-linear loads
Variable-speed drives, switched-mode power supplies, LED lighting, chargers and other power-electronic consumers can draw non-sinusoidal currents. This produces harmonics.
These can, among other things:
- place additional loading on the neutral conductor,
- heat transformers and cables,
- increase losses,
- affect power-factor correction systems,
- distort measurements made with unsuitable instruments.
For a pure energy and load-profile analysis, a power and energy recorder with True RMS measurement is often sufficient. If power-quality problems are suspected, a power-quality analyser should be used that can evaluate harmonics, THD and, where applicable, events or waveforms in greater detail.
Evaluating load-profile data systematically
A structured evaluation can be carried out in several steps:
- Check measurement plausibility: Verify channel assignment, polarity, network configuration and current sensors.
- Determine total energy: Compare the recorded energy with existing meter readings.
- Identify base load: Examine nights, breaks and weekends separately.
- Determine peak values: Distinguish instantaneous maximum values from averaged load peaks.
- Assign operating times: Compare load changes with production and machine records.
- Compare phases: Identify imbalance and unusual single-phase loads.
- Check power factor: Assess reactive and apparent power.
- Prioritise measures: Compare potential savings, feasibility and operational impact.
To compare different days, it can be useful to superimpose daily profiles. Recurring peaks are easier to identify in this way than in one long continuous time series.
A sorted load-duration curve is also useful. In this representation, all power values are arranged from highest to lowest. It shows how many hours a particular power level was exceeded, but it no longer shows the chronological sequence.
Deriving potential savings from the load profile
Typical measures include:
- switching off unnecessary base-load consumers outside operating hours,
- staggering machine starts,
- shifting heating processes and charging times,
- eliminating compressed-air leaks,
- optimising compressor and pump controls,
- reducing standby times,
- using load management for furnaces, refrigeration systems or charging points,
- improving power factor and reactive power,
- installing sub-meters in areas that remain conspicuous.
Before an investment is made, the expected savings should be calculated using the measured load profile. The rated connected load of a consumer alone is not sufficient. The actual power consumption and operating time are decisive.
After implementation, a comparative measurement under production conditions that are as similar as possible is required. Only then can it be determined whether the measure has actually reduced energy consumption or peak load.
Typical measurement and interpretation errors
Current is treated as equivalent to power
Voltage, phase displacement and current distortion are not considered. The calculated power may differ significantly from the actual value.
Current sensors and voltage channels are interchanged
The current of L1 is calculated together with the voltage of L2. The resulting power factor and power values are implausible.
Current sensors are installed in the wrong direction
Consumption appears as feed-in, or the individual phases partly cancel each other in the total power calculation.
The current measuring range is too large
The normal load current uses only a small part of the sensor range. Small consumers and changes in base load are measured less accurately.
The measuring period is too short
Weekend base load, infrequently operated major consumers or shift changes are missing from the recording.
The measuring interval is too long
Short peaks and machine cycles are smoothed out and remain invisible.
A one-second maximum is confused with the contractual peak load
The energy supplier may average power over a longer interval. The two values serve different assessment purposes.
The entire base load is regarded as wasted energy
Essential safety, cooling, IT or standby systems are not distinguished from avoidable continuous consumers.
Production output is not considered
A day with higher energy consumption may be more efficient if considerably more was produced at the same time. In addition to absolute consumption, an appropriate energy-performance indicator per product or process should therefore be assessed.
Safe installation in the control cabinet
For power measurement, voltage leads are connected directly to the electrical network. Installation may therefore only be carried out by appropriately qualified personnel in accordance with the company’s safety procedures.
The following in particular must be checked before the measurement:
- measurement category and permissible voltage of the recorder,
- measurement category of cables, terminals and current sensors,
- expected short-circuit current at the measuring point,
- safe and touch-protected connection points,
- suitable personal protective equipment,
- strain relief and secure cable routing,
- closing of the control cabinet during the recording.
Even though current clamps can be installed without interrupting the conductor, this does not mean that the complete installation can safely be carried out while energised. The applicable isolation and protection concept for the facility is decisive.
Practical example: Load profile of a production facility
A metalworking company knows its monthly energy consumption but cannot assign recurring load peaks to a specific system. A power and energy recorder is installed at the main distribution board for seven complete days.
The recording shows:
- a base load of approximately 38 kW during the night,
- a normal production load between 140 and 230 kW,
- recurring averaged peaks of more than 350 kW at the start of the shift,
- additional short start-up peaks when large motors are started.
A comparison with the machine records shows that, at the start of the shift, an electric furnace is heating up, the central compressed-air compressor is recharging and several machine tools are being started at the same time.
Measurements at the sub-distribution boards also show that part of the night-time base load is caused by the compressor. During non-production periods, it repeatedly starts even though no planned compressed-air consumers are active. A leak survey confirms unnecessary compressed-air consumption.
The following measures are implemented:
- the furnace heating process is brought forward,
- machine starts are staggered,
- compressed-air leaks are eliminated,
- unnecessary extraction systems are switched off automatically.
A second measuring campaign under comparable utilisation conditions shows a lower base load and significantly lower averaged load peaks. Production output remains unchanged.
The example demonstrates that energy consumption and peak load can have different causes. The leakage mainly affects the energy consumed over many hours, while the simultaneous machine starts are responsible for the load peak.
Selecting the measuring instrument and current sensors
At least the following information is required for selection:
- single-phase or three-phase system,
- network voltage and frequency,
- maximum and typical operating current,
- conductor diameter or busbar dimensions,
- alternating current, direct current or mixed application,
- measurement at the main distribution board or sub-distribution board,
- required measuring period and time resolution,
- required active, reactive and apparent power values,
- requirements for harmonic and power-quality analysis,
- indoor or outdoor use,
- local or remote access to the data,
- export, reporting and cost-analysis requirements,
- measurement category and ambient conditions.
An energy recorder is particularly suitable for long-term load and consumption profiles. To investigate voltage dips, transient events or detailed harmonics, however, a correspondingly equipped power-quality analyser is required.
Which measuring instruments and products are suitable?
Power and energy analysers
The power and energy analysers / energy recorders category includes instruments for recording load profiles, carrying out energy audits, measuring consumption and analysing electrical networks.
Depending on the version, different voltage and current inputs, current sensors, storage intervals, communication options and analysis functions are available.
PEL 113 power and energy recorder
The PEL 113 is a compact power and energy recorder with three voltage inputs, three current inputs and an illuminated digital display.
Among other quantities, it measures and records:
- active, reactive and apparent power,
- active, reactive and apparent energy,
- power factor and phase parameters,
- voltages and currents,
- total harmonic distortion of current and voltage.
Measured values can be transferred via USB, Ethernet or Wi-Fi and evaluated using the PEL Transfer software. The instrument is particularly suitable for energy audits, load profiles and industrial maintenance tasks.
PEL104 power and energy logger
The PEL104 is designed for extended measuring campaigns and detailed energy-consumption analyses.
It enables continuous recording with an acquisition interval down to 200 ms. Measured data are stored on an SD memory card. Depending on the configuration, USB, Ethernet, Bluetooth, Wi-Fi and mobile communications are available for communication and remote access.
This allows both long-term load profiles and comparatively short power changes to be recorded. Alarm limits support the monitoring of specified power values.
PEL106 for outdoor installations and harsh environments
The PEL106 has a field-ready housing rated to IP67 and is therefore also suitable for measuring campaigns outdoors or in harsh environmental conditions.
It has four voltage inputs and four current inputs and records power and energy values with an acquisition interval down to 200 ms. Various communication interfaces enable longer measuring campaigns to be monitored remotely.
PEL112 as a compact recorder without a display
The PEL112 is a compact power and energy recorder with magnetic mounting and three voltage and three current inputs.
The version without a display is suitable for longer-term installation in a control cabinet. The instrument can also be used at ambient temperatures down to −20 °C, making it suitable for applications such as cold-storage facilities.
PQA820 for supplementary power and network analysis
The PQA820 combines the recording of power and energy with advanced electrical-network parameters.
In addition to active, reactive and apparent power and the corresponding energy values, the instrument records power factor, frequency, THD and voltage and current harmonics up to the 50th order.
The PQA820 is therefore suitable when the influence of variable-speed drives, switched-mode power supplies or other non-linear consumers is to be investigated in addition to the load profile.
Conclusion: The load profile makes energy consumption and power demand transparent
A totalising meter shows only the energy consumed. A load profile adds the time dimension and shows when base load, production load and power peaks occur.
For a reliable analysis, voltage and current must be measured simultaneously. Recording current alone cannot reliably determine the actual active power in the presence of reactive power, imbalance and non-linear loads.
The measuring period and recording interval depend on the objective. Short intervals reveal machine starts and load steps, while longer measuring campaigns capture shift, weekend and base-load profiles.
The highest instantaneous power must not automatically be treated as the contractually relevant peak load. The averaging interval used for the respective assessment is decisive.
Particularly large savings are often found in unnecessary continuous consumers and the simultaneous operation of large loads. A comparative measurement after implementation shows whether the measures have actually been effective.
Frequently asked questions about load-profile measurement
What is the difference between power and energy?
Power describes the instantaneous energy demand in kilowatts. Energy describes the electrical work consumed over a period of time in kilowatt-hours.
How long should a load profile be measured?
The measurement should cover at least one complete representative operating cycle. For shift, night-time and weekend profiles, a measuring period of at least one week is often appropriate.
Can I measure the load profile using only a current clamp?
A current clamp shows the current profile. For accurate active-power and energy measurement, voltage and the phase relationship must also be recorded.
What is the base load of a company?
The base load is the power that remains continuously even when production is low or completely stopped. Typical causes include cooling, compressed air, ventilation, pumps, IT systems and standby consumers.
What is peak load?
Peak load is the highest power value within a defined evaluation interval. Very short start-up peaks and load peaks averaged over several minutes must be assessed separately.
Why does the measuring instrument display negative power?
Possible causes include a current sensor installed in the wrong direction, incorrect assignment of current and voltage channels or actual energy being fed back into the network.
How can I find out which consumer is causing a peak?
The load profile is compared with machine, shift and production records. If necessary, sub-distribution boards or individual major consumers are subsequently measured separately.
Which measuring interval is correct?
The interval must be shorter than the shortest relevant process. Machine starts require high time resolution. For weekly profiles, condensed minute or quarter-hour values can additionally be used.
When do I need a power-quality analyser?
A power-quality analyser is useful when harmonics, voltage dips, imbalance or other network disturbances are to be investigated in addition to power and energy.
Which information does ICS Schneider require for selection?
The required information includes the network configuration, voltage, current range, conductor dimensions, measuring period, required time resolution, indoor or outdoor use, required power and energy quantities, communication requirements and requirements for harmonic and power-quality analysis.