


Many electrical problems do not occur continuously. A machine may shut down only occasionally because of undervoltage, a compressor may cause a noticeable load peak in the morning, or energy consumption may rise unexpectedly outside production hours. In such cases, an instantaneous measurement using a multimeter or current clamp often shows inconspicuous values.
Current and voltage data loggers record electrical measured variables over hours, days or weeks. This makes temporal relationships visible: When does the current increase? Does the voltage drop at the same time? Which loads continue operating at night? How long does a starting process take, and does the fault always occur at the same time?
For reliable results, however, the measuring instrument must be suitable for the task. A simple current logger is well suited to recording operating conditions and long-term load profiles. Precise energy consumption, three-phase power, very short voltage dips or power-quality events, by contrast, require a power, energy or power-quality analyser.
Table of Contents
- When is long-term recording useful?
- Which measured variables can be recorded?
- Why TRMS is important for distorted signals
- Recording load profiles with a current logger
- Distinguishing current consumption from energy consumption
- Recording voltage dips correctly
- Detecting starting currents and load changes
- Measuring single-phase and three-phase systems
- Selecting current transformers and current clamps
- Distinguishing measuring interval, sampling rate and aggregation
- Planning the measuring duration, memory and power supply
- Safe installation inside the control cabinet
- Evaluating measured data systematically
- Timestamps, data export and documentation
- Data logger or power-quality analyser?
- Recommended measuring strategy
- Typical measurement and selection errors
- Practical example: Sporadic undervoltage during machine start-up
- Information required for instrument selection
- Which products are suitable?
- Conclusion
- Frequently asked questions
When is long-term recording useful?
A data logger is useful when the relevant operating condition cannot be deliberately reproduced during a short measurement or when a time-dependent profile must be evaluated.
Typical tasks include:
- recording load profiles of machines and sub-distribution systems,
- determining the base load during breaks, at night or at weekends,
- detecting sporadic overloads,
- comparing voltage fluctuations with machine faults,
- monitoring the current consumption of pumps, motors and compressors,
- documenting switching and starting processes over time,
- comparing consumption before and after an efficiency measure,
- collecting evidence of a suspected supply fault,
- comparing different operating conditions or production shifts.
A long-term measurement does not replace professional fault analysis. However, it provides the time-related evidence that is often missing with sporadic problems.
Which measured variables can be recorded?
Different electrical variables are stored depending on the type of instrument.
| Instrument type | Typical measured variables | Suitable task |
|---|---|---|
| Current data logger | AC current, sometimes Min./Max. values and mean values | Detecting load conditions, operating times and overloads |
| Voltage data logger | AC or DC voltage over time | Monitoring supply voltages, batteries, PV installations and longer voltage fluctuations |
| Power and energy recorder | Voltage, current, active, reactive and apparent power, as well as energy | Evaluating load profiles and energy consumption |
| Power-quality analyser | Additionally frequency, THD, harmonics, flicker, unbalance and events | Investigating mains faults and voltage quality |
Before selecting an instrument, the actual question must therefore be clarified first. If the only requirement is to determine when a motor is operating, a current logger may be sufficient. If electrical energy consumption in kWh is to be determined, voltage, current, time and, with alternating current, the phase relationship must also be taken into account.
Why TRMS is important for distorted signals
TRMS stands for True Root Mean Square, or true RMS. A TRMS instrument calculates the RMS value even with signals that are not ideally sinusoidal.
This is particularly important with:
- frequency converters,
- switch-mode power supplies,
- LED lighting,
- welding equipment,
- controlled heating systems,
- UPS systems,
- non-linear electronic loads.
A simple average-responding instrument can display significantly incorrect values with distorted currents or voltages. For a load or energy analysis, it should therefore be checked whether the logger and current sensor are suitable for the existing waveform, frequency and expected crest factor.
TRMS alone does not constitute a power-quality analysis. An instrument can display the correct overall RMS value without resolving the individual harmonics or very short transients.
Recording load profiles with a current logger
A current logger records current over time. This makes it possible to determine when a load is active and how its loading changes.
Typical characteristics of a current profile include:
- machine start and machine stop,
- no-load, partial-load and full-load operation,
- recurring production cycles,
- compressor or pump operating times,
- unusual continuous loads,
- load peaks caused by consumers starting simultaneously,
- unequal phase loading.
A current profile can already provide valuable information for maintenance and energy efficiency. If, for example, the motor current rises over several weeks, possible causes include an increasing mechanical load, contaminated filters, stiff bearings or changed process conditions.
However, the precise active power must not be inferred directly from the current value alone. Voltage, power factor and waveform may also change.
Distinguishing current consumption from energy consumption
Current, power and energy describe different quantities:
- Current in A: instantaneous electrical current consumption,
- Power in kW: instantaneous energy demand,
- Energy in kWh: electrical work consumed over a period of time.
For a resistive single-phase load, the power can be calculated approximately from the voltage and current. With motors, frequency converters and other complex loads, the power factor must also be taken into account.
In a three-phase network, the voltage and current channels must also be assigned correctly. A current recording can therefore show a load profile, but it cannot replace reliable energy metering.
For an accurate energy analysis, a power or energy recorder should be used that measures voltage and current simultaneously and calculates active, reactive and apparent power as well as energy.
Recording voltage dips correctly
A voltage dip is a temporary reduction in the supply voltage. Possible causes include:
- starting large motors or compressors,
- large load changes,
- short circuits or faults within the network,
- network switching operations,
- welding equipment,
- weak or long supply cables,
- faults within the upstream supply.
The effect depends not only on the remaining voltage but also on the duration of the dip. A very short event may already be sufficient to cause a contactor to drop out, a frequency converter to generate an undervoltage message or a PLC to restart.
A conventional long-term logger storing one value per second can detect longer voltage deviations. However, a dip lasting only a few mains cycles may occur between two recorded values or may be attenuated by averaging.
The following must therefore be clarified during selection:
- How short can the suspected event be?
- Are instantaneous, mean, minimum or maximum values stored?
- Does the instrument have event-triggered recording?
- Can the depth and duration of the dip be determined?
- Must several phases be monitored simultaneously?
A power-quality analyser with suitable event recording is required for short network events or events that must be assessed according to standards.
Detecting starting currents and load changes
Motors, transformers, power supplies and heating systems can draw considerably higher currents when switched on than during subsequent continuous operation.
For a meaningful measurement, two tasks must be distinguished:
- Load profile: When does the consumer start and how long does it operate?
- Inrush measurement: How high is the brief starting current immediately after switching on?
A logger taking one measurement per second can show a motor acceleration lasting several seconds. However, it cannot reliably capture a very short current pulse lasting only a few milliseconds.
For starting problems, current and voltage should be recorded simultaneously wherever possible. A high starting current can reduce the voltage. The lower voltage can in turn extend the acceleration time, causing the increased current to persist for longer.
An instrument with an inrush function or correspondingly fast recording is required for very short switching processes.
Measuring single-phase and three-phase systems
Single-phase loads
For complete power measurement on a single-phase load, the voltage between phase and neutral conductor and the current in the phase conductor are normally recorded.
The current sensor must not enclose the phase and neutral conductor simultaneously. Their opposing currents would largely cancel each other magnetically.
Three-phase loads
In a three-phase system, the required measuring setup depends on the network configuration, symmetry and required evaluation.
A complete three-phase analysis typically requires:
- voltage L1, L2 and L3,
- where applicable, neutral-conductor voltage,
- current I1, I2 and I3,
- where applicable, neutral-conductor current,
- correct assignment of each current channel to the corresponding voltage,
- correct current direction of the sensors.
If, for example, the current of L1 is calculated using the voltage of L2, the power and power factor may be calculated incorrectly. A current sensor fitted in the wrong direction can indicate negative active power.
A two-channel current logger can compare two circuits, but it does not replace a complete three-phase power analysis with three or four current and voltage channels.
Selecting current transformers and current clamps
The current sensor is an essential part of the measuring chain. Its measuring range, measuring principle and mechanical design must be suitable for the installation.
| Sensor type | Advantage | Points to consider |
|---|---|---|
| Rigid current clamp | Simple installation and well suited to many standard conductors | Check the jaw opening and accessibility |
| Flexible Rogowski coil | Suitable for large conductors, busbars and confined control cabinets | Generally measures alternating current and requires suitable evaluation electronics |
| Hall-effect current clamp | Depending on the model, AC and DC measurement | Observe the zero point, power supply and measuring range |
| Split-core current transformer | Can be retrofitted without disconnecting the primary conductor | The transformation ratio and downstream measuring instrument must be compatible |
An excessively large measuring range can result in poorer resolution at low operating currents. A range that is too small can be overloaded by starting or peak currents.
The following applies during installation:
- enclose only the intended individual conductor,
- observe the current direction or arrow,
- close the clamp or coil completely,
- do not crush or severely twist the sensor,
- document the assignment to the measuring channel,
- observe the permissible measurement category and voltage relative to earth potential.
Suitable solutions can be found in the current clamps / flexible current transformers category.
Distinguishing measuring interval, sampling rate and aggregation
The terms measuring rate, storage interval and aggregation are frequently confused.
- Sampling or acquisition rate: How often the instrument internally determines a measured value.
- Storage interval: How often a value is stored permanently.
- Aggregation: Combining several measured values into a mean, minimum or maximum value.
An instrument may, for example, measure every second but store only one mean value every 15 minutes. This produces a clear long-term profile, but short load peaks are barely visible in the mean value.
| Measuring task | Suitable recording | Note |
|---|---|---|
| Base load over several weeks | Minute values or 15-minute aggregation | Shift and weekend profiles are the main focus |
| Machine cycles | One second or faster | The interval must be shorter than the relevant cycle |
| Motor acceleration lasting several seconds | High time resolution | Record current and voltage simultaneously wherever possible |
| Very short inrush current | Inrush or fast event function | A conventional long-term logger may be too slow |
| Short voltage dip | Event recording with a suitable sampling rate | The depth and duration must be recorded |
The interval should be as short as necessary, but not automatically as short as technically possible. An unnecessarily large amount of data makes evaluation more difficult and places additional demands on memory and the power supply.
Planning the measuring duration, memory and power supply
The measuring duration should cover at least one complete representative operating cycle.
Depending on the question, this may mean:
- several machine cycles,
- a complete shift,
- day and night operation,
- a complete working week,
- the weekend and production shutdown,
- a seasonal or monthly operating period.
The following must be checked before starting the measurement:
- number of channels,
- acquisition and storage interval,
- available memory,
- battery operating time,
- possible supply via USB or mains,
- behaviour in the event of a power failure,
- automatic or manual start,
- correct time setting.
A measuring campaign must not be planned solely on the basis of the theoretical storage capacity. Batteries, wireless communication, ambient temperature and display operation also influence the possible recording duration.
Safe installation inside the control cabinet
Measurements on low-voltage distribution systems can involve dangerous touch voltages and high short-circuit energies. Installation and removal may be carried out only by appropriately qualified personnel and in accordance with the procedure defined for the installation.
The following must be considered in particular:
- measurement category and maximum instrument voltage,
- suitable and undamaged test leads,
- fused voltage inputs,
- personal protective equipment,
- protection against contact after installation,
- secure mounting of the logger,
- no loose cables near moving or hot components,
- sufficient clearance from exposed live parts,
- safe cable routing through the control-cabinet door or a completely closed door.
Flexible current sensors make retrofitting easier but do not eliminate the electrical hazards inside the control cabinet. Even non-contact current measurement may require an energised distribution board to be opened.
Evaluating measured data systematically
A long curve is only useful when it is compared with the operating processes.
At least the following should be considered during evaluation:
- time of maximum and minimum values,
- base load during non-production periods,
- differences between shifts and weekdays,
- recurring load cycles,
- simultaneous current peaks from several loads,
- relationship between voltage dips and load increases,
- deviations between comparable machines,
- changes before and after maintenance.
It is useful to compare the data with:
- machine and PLC logs,
- shift schedules,
- fault messages,
- production data,
- maintenance work,
- compressor or pump control systems,
- energy-meter readings.
A high current value is not automatically a fault. It may be caused by a higher actual process load. Similarly, a simultaneous voltage dip does not by itself prove that it caused the fault. The measured values must be assessed for technical plausibility.
Timestamps, data export and documentation
Accurate timestamps are particularly important for subsequent evaluation. A deviation of only a few minutes can already make comparison with machine messages more difficult.
The date, time and time zone should therefore be checked before starting. When several loggers are used, all instruments should be synchronised as closely as possible.
Traceable documentation includes:
- measuring task and suspected fault pattern,
- measuring instrument and serial number,
- current sensors and measuring ranges used,
- network configuration,
- connection diagram and channel assignment,
- measuring interval and aggregation,
- start and end time,
- operating condition of the installation,
- special events during the measurement,
- exported raw data and evaluation report.
CSV files are well suited to further evaluation using spreadsheet or analysis software. For a complete test report, however, the instrument settings and connection conditions should also be stored.
Data logger or power-quality analyser?
| Requirement | Suitable instrument |
|---|---|
| Detect the operating time of an individual load | Single-channel current logger |
| Compare two circuits | Two-channel current logger |
| Monitor AC or DC voltage over a longer period | Voltage data logger |
| Record active power and energy consumption | Power and energy recorder |
| Measure three-phase load profiles | Three-phase power and energy recorder |
| Evaluate harmonics and THD | Power or mains analyser |
| Record short voltage dips and interruptions | Power-quality analyser with event recording |
| Investigate very short transients | Suitable power-quality analyser or oscilloscope |
The simplest instrument design is economically appropriate when it can answer the question reliably. A complex power analyser is not required for every operating-hours recording. Conversely, a simple long-term logger must not be used for events that occur faster than it can capture them.
Recommended measuring strategy
- Define the fault pattern: Clearly distinguish between load profile, energy consumption, voltage dip and starting current.
- Define the required measured variables: Current only, or also voltage, power and power quality?
- Determine the period: The relevant operating condition must definitely be included.
- Select the instrument and sensors: Consider the measuring range, number of channels, measurement category and waveform.
- Define the measuring interval: Select an interval shorter than the shortest relevant process.
- Plan the connection: Document the network configuration, phase assignment and current direction.
- Perform a plausibility check: Compare instantaneous values with known installation values before starting.
- Start the recording: Check the time, memory and power supply.
- Document operating events: Record machine starts, faults and maintenance activities with their times.
- Evaluate the data: Consider current, voltage and plant condition together.
- Verify the measure: Perform a comparative measurement after making a change.
Typical measurement and selection errors
A current logger is used for precise energy measurement
Voltage, power factor and phase relationship are not taken into account. The result is at best an approximation.
The measuring interval is too long
Short machine starts, voltage dips or current peaks occur between the stored values.
Only mean values are stored
Short minimum and maximum values are concealed by the aggregation.
An excessively large current range is selected
Small changes within the normal operating range are resolved inadequately.
The phase and neutral conductor are enclosed together
The magnetic fields largely cancel each other and the displayed current is much too low.
The current sensors are assigned incorrectly
During three-phase power measurement, the current and voltage of different phases are used together in the calculation.
The current direction is incorrect
The calculated active power appears negative even though the installation is consuming energy.
The logger time is incorrect
Measured values cannot be compared reliably with machine and fault messages.
The logger is placed loosely inside the control cabinet
Cables may become detached, the door may not close safely or the instrument may move close to live parts.
A simple voltage logger is expected to record very short dips
The event is faster than the measuring rate or storage interval and remains invisible.
Practical example: Sporadic undervoltage during machine start-up
A production machine intermittently reports undervoltage at its frequency converter. During normal control measurements, the supply remains stable at approximately 400 V. The fault occurs only a few times per week.
It is initially suspected that a large motor connected to the same sub-distribution system is causing the voltage dip. To investigate the issue, current and voltage are recorded simultaneously over several production days.
The measurement records:
- the three line-to-line voltages,
- the three phase currents of the affected machine,
- the time and duration of machine starts,
- fault messages from the frequency converter.
The evaluation reveals a recurring relationship:
- A large compressor starts.
- The total current of the sub-distribution system rises sharply.
- The voltage falls significantly for a short period.
- The production machine’s frequency converter reports undervoltage.
It is also established that the compressor and an extraction system frequently start simultaneously. Staggering their start enables reduces the combined load peak.
A subsequent comparative measurement shows a smaller voltage dip. The undervoltage message does not recur during the observed period.
The example also illustrates the limitations of a current logger alone: the current profile would have shown the load change, but it would not have proved that the supply voltage actually dipped at the same time.
Information required for instrument selection
At least the following information is required when selecting a current or voltage data logger:
- measuring task: load profile, energy consumption, voltage dip or starting current,
- AC or DC,
- single-phase or three-phase network,
- rated voltage and maximum possible voltage,
- normal current and possible peak current,
- number of required channels,
- conductor diameter or busbar dimensions,
- required measuring duration,
- shortest relevant event,
- required measuring and storage interval,
- TRMS requirement and existing waveform,
- Min./Max. or event recording,
- required power, energy or power-quality values,
- measurement category and location of use,
- USB, WLAN or remote access,
- data export and report generation,
- battery or external power supply.
A meaningful enquiry could read as follows:
Temporary long-term measurement on a three-phase 400 V sub-distribution system, currents up to 800 A AC, flexible current sensors for large busbars, recording voltage, current, active and apparent power as well as energy over seven days, measuring interval no longer than one second, additional detection of voltage dips and data export for PC evaluation.
Which products are suitable?
Current and voltage data loggers
The current and voltage data loggers category includes instruments for temporary and long-term recording of electrical measured variables.
Depending on the version, available options include:
- single- and multi-channel current loggers,
- AC and DC voltage loggers,
- power and energy recorders,
- loggers with flexible current transformers,
- USB, WLAN and remote access,
- software for analysis and report generation.
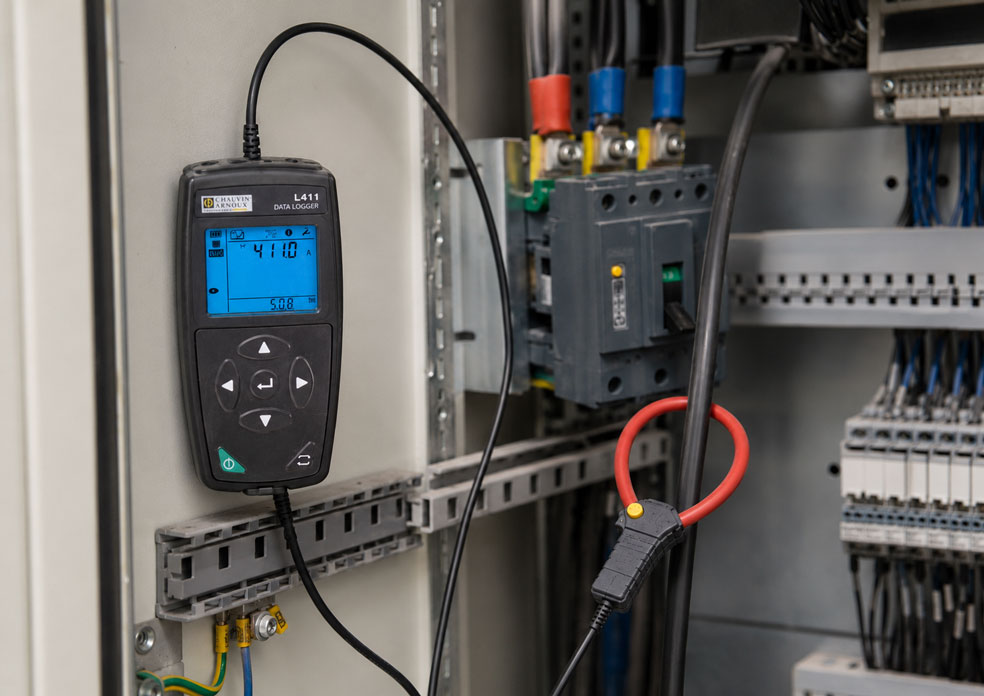
LOGGER L411 current data logger
The LOGGER L411 is a single-channel current data logger for long-term AC current recording.
Its main features include:
- one current measuring channel,
- measuring ranges up to 3,000 A AC depending on the version,
- acquisition of up to one measured value per second,
- aggregation from 1 to 60 minutes,
- 8 GB memory,
- USB and WLAN communication,
- software for analysis and report generation,
- electrical safety up to 600 V CAT IV or 1,000 V CAT III.
The L411 is particularly suitable for monitoring individual loads, cables or machines over longer periods.
LOGGER L412 current data logger
The LOGGER L412 has two current measuring channels.
This allows, for example:
- two loads to be compared,
- the input and output of part of an installation to be monitored,
- two phases or circuits to be recorded simultaneously,
- main and secondary loads to be compared over time
.
The current measuring range depends on the selected current sensor. The instrument records up to one measured value per second and also supports aggregation periods from 1 to 60 minutes.
LOGGER L461 voltage data logger
The LOGGER L461 is a single-channel voltage data logger for AC and DC applications.
Its features include:
- measurement from 10 to 1,200 V AC,
- measurement from 10 to 1,700 V DC,
- suitability for photovoltaic applications up to 1,500 V DC rated voltage,
- acquisition of up to one measured value per second,
- aggregation from 1 to 60 minutes,
- USB, WLAN and web-server communication,
- 8 GB memory.
The L461 is suitable for long-term profiles and longer-lasting voltage deviations. For very short voltage dips, it must be checked whether its time resolution is sufficient for the expected event.
PQA 820 power and network analyser
The PQA 820 is suitable for more comprehensive single-phase and three-phase power, energy and network analyses.
The instrument offers, among other features:
- four current channels,
- four voltage inputs,
- TRMS measurement of current and voltage,
- measurement of active, reactive and apparent power,
- measurement of active, reactive and apparent energy,
- measurement of power factor and frequency,
- THD and harmonic analysis up to the 50th order,
- USB and WLAN communication,
- use in single-phase and three-phase networks.
The PQA 820 is appropriate when a simple current or voltage profile is insufficient and power, energy, phase assignment or harmonics must be evaluated together.
Conclusion: The time resolution must match the fault
Current and voltage data loggers reveal electrical conditions that remain undetected during a short instantaneous measurement. They are suitable for load profiles, operating times, base loads, long-term voltage fluctuations and the analysis of sporadic plant problems.
A current logger shows when and how heavily a load is operating. However, voltage, current and phase relationship must be measured together to determine active power and energy consumption accurately.
The time resolution is decisive. One measured value per second can capture machine cycles and longer starting processes, but may miss very short voltage dips or inrush currents. Fast or event-triggered measuring instruments are required for such events.
For three-phase measurements, the network configuration, phase assignment and current direction must be set correctly. Errors at this point can produce incorrect power and energy data despite plausible individual values.
The best measuring setup is therefore not automatically the one that generates the largest quantity of data, but the one that matches the measured variable, number of channels, measuring range, time resolution and measuring duration precisely to the question being answered.
Frequently asked questions about current and voltage data loggers
What does a current data logger show?
It records current consumption over time. This makes operating times, load changes, overloads and recurring machine cycles visible.
Can I measure energy consumption in kWh using a current logger?
Not accurately if only the current is recorded. Correct energy measurement also requires voltage, power factor or phase relationship, and time.
How can I detect a voltage dip?
The voltage must be recorded with sufficient time resolution. An instrument with event recording or a power-quality analyser is required for very short dips.
Is one measured value per second sufficient for a motor start?
It may be sufficient for acceleration lasting several seconds. However, very short inrush-current peaks may not be recorded.
Can a Rogowski coil measure direct current?
No. A conventional Rogowski coil responds to currents that change over time and is therefore suitable for alternating current. A suitable Hall-effect sensor, for example, is required for direct current.
Why must the current clamp enclose only one conductor?
If the outgoing and return conductors are enclosed together, they generate opposing magnetic fields. The displayed current is therefore greatly reduced or almost zero.
How long should a load profile be recorded?
The measurement should cover at least one complete representative operating cycle. A complete week is often appropriate for recording shift, night and weekend profiles.
When do I need a power-quality analyser instead of a data logger?
A power-quality analyser is required when harmonics, THD, flicker, unbalance, short voltage dips or other power-quality events must also be assessed.
Can a two-channel current logger fully analyse a three-phase system?
No. It can compare two currents, but it does not automatically record all three phases, voltages, phase angles and power values of a three-phase system.
Which information does ICS Schneider require for selection?
The required information includes the measuring task, network type, AC or DC, voltage, normal and maximum current, number of channels, conductor dimensions, measuring duration, shortest relevant event, required time resolution, measurement category, current-sensor design and required evaluation.