


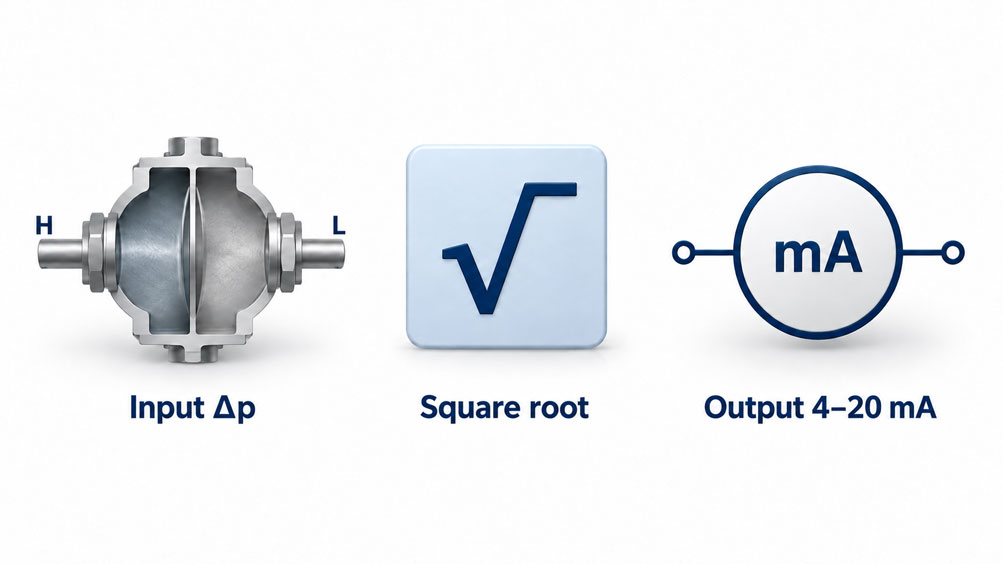
A flow transmitter with square root extraction can deliver correct readings at the lower and upper ends of its measuring range while still indicating substantially incorrect values in between. The reason is that a linear characteristic, a correctly implemented square root function and inadvertently repeated square root extraction all agree at 0 and 100 %. Checking the endpoints alone is therefore insufficient to assess the transfer from differential pressure to the flow signal.
For a meaningful calibration, pressure measurement, the calculation function and the actual current output must be distinguished from one another. It is also necessary to establish whether square root extraction takes place in the transmitter, in a separate signal converter or in the PLC. This article describes a test procedure with suitable references, calculated test points, separate evaluation of deviations and clearly documented results. It focuses on differential pressure flow measurement and electrical square root extraction modules with 4 … 20 mA signals.
Table of Contents
- Define the Test Task and the Limits of Calibration
- Clarify the Signal Path and Where Square Root Extraction Takes Place
- Calculate the Ideal Square Root Characteristic Correctly
- Distribute Test Points by Pressure or Flow Rate
- Distinguish What Each Test Establishes
- Record the Configuration and As-Found Condition
- Select a Suitable Pressure Reference
- Set Up the Pneumatic Test Arrangement
- Connect the Current Loop and Communication
- Plan Stabilisation and Data Acquisition
- Calibrate the Input Stage
- Test the Actual Current Output Separately
- Verify the Square Root Function Separately
- Test the Complete Chain and Downstream Scaling
- Account for Low-Flow Cutoff and Damping
- Assess Measurement Deviations Using the Correct Reference Basis
- Propagate Measurement Uncertainty Through Square Root Extraction
- Separate the Tolerance Decision, Adjustment and Final Verification
- Systematically Distinguish Typical Faults
- Document Results Reproducibly
- Suitable Calibration Equipment from ICS Schneider
- Conclusion: Every Test Value Needs a Clearly Defined Signal Path
- Frequently Asked Questions About Calibration with Square Root Extraction
1. Define the Test Task and the Limits of Calibration
First, define what constitutes the input to the device under test. For a differential pressure transmitter, it is a physically applied pressure difference between the high- and low-pressure sides. For a separate square root extraction converter, it may be an electrical signal, such as a current of 4 … 20 mA proportional to differential pressure. These two tasks require different references and connections.
Pressure calibration of the transmitter, including a test of its output with square root extraction, verifies the transfer from the applied differential pressure to the output signal under the documented conditions. It does not detect wear of an orifice plate, an unsuitable upstream straight length or an incorrectly specified operating density. Verification of the complete flow measurement also requires consideration of the primary element, its installation conditions and, where appropriate, a flow reference.
The test specification should therefore explicitly state the input, output, measuring range, active transfer characteristic and components to be included. Without this information, the statement “flow calibrated” is too vague if only a current was actually injected into a PLC input.
2. Clarify the Signal Path and Where Square Root Extraction Takes Place
In a typical differential pressure flow measurement, the sensor first measures the differential pressure. The electronics condition the measured value, map it to a range and, where configured, calculate a value proportional to flow rate. The output stage then generates the current. The PLC can subsequently scale and filter this current and use it for display, control or alarms.
For the simple measurement path, conversion from a value proportional to differential pressure to a value proportional to flow rate must take place exactly once. If the transmitter already outputs a current signal linear with flow rate, the PLC processes it linearly. If the transmitter outputs differential pressure linearly, a downstream module performs the square root extraction.
The local display does not provide reliable evidence of the analogue output characteristic. Depending on the device, the display and current signal can be configured differently. Digital variables must also be identified by their meaning, unit and position in the signal path. A value labelled PV is not automatically the differential pressure before square root extraction in every device.
The principles of signal assignment are explained further in the article Square Root Extraction in Differential Pressure Transmitters: Correctly Scaling the 4–20 mA Signal for Differential Pressure Flow Measurement.
3. Calculate the Ideal Square Root Characteristic Correctly
The following test model assumes a differential pressure range starting at zero, a positive flow direction, constant density and unchanged flow coefficients. Special functions at the lower end of the range are initially excluded. With normalised differential pressure x and normalised flow rate y, the following relationships apply:
x = Δp / Δpmax
y = Q / Qmax = √x
Iexpected = 4 mA + 16 mA · √x
An electrical square root extraction module often receives a linear current representation of the pressure instead of a physical pressure input. The normalisation is then:
x = (Iin − 4 mA) / 16 mA
The square root is taken from this dimensionless quantity. Taking the square root of the current value directly, or normalising by 20 mA instead of the 16 mA span, produces a different characteristic. For example, an input of 8 mA gives x = 0.25. The output linear with flow rate must therefore be 12 mA.
For an elevated lower range value, reverse flow, special transfer characteristics or additional density compensation, the actual device model is decisive. In particular, a value normalised to an arbitrarily shifted pressure span must not be assumed to equal the physical ratio Δp / Δpmax without verification.
4. Distribute Test Points by Pressure or Flow Rate
Equally spaced flow test points require the corresponding differential pressures to follow a quadratic distribution. One example uses 0 … 100 mbar differential pressure, assigned to 0 … 100 m³/h, with an output of 4 … 20 mA linear with flow rate. The flow values here are calculated values assigned to the pressure points; no corresponding volumetric flow actually passes through the pressure test arrangement.
| Target Flow Rate | Differential Pressure to Apply | Alternative Current Input Linear with Δp | Ideal Current Output with Square Root Extraction |
|---|---|---|---|
| 0 m³/h / 0 % | 0 mbar / 0 % | 4.00 mA | 4.00 mA |
| 25 m³/h / 25 % | 6.25 mbar / 6.25 % | 5.00 mA | 8.00 mA |
| 50 m³/h / 50 % | 25.00 mbar / 25 % | 8.00 mA | 12.00 mA |
| 75 m³/h / 75 % | 56.25 mbar / 56.25 % | 13.00 mA | 16.00 mA |
| 100 m³/h / 100 % | 100.00 mbar / 100 % | 20.00 mA | 20.00 mA |
The third column applies when testing an electrical square root extraction module or the corresponding PLC path. It is not an additional signal to be injected into a pressure transmitter. Equally spaced pressure points of 0, 25, 50, 75 and 100 mbar are also useful, particularly for the pressure measurement stage. The ideal output values with square root extraction are then, rounded, 4.000; 12.000; 15.314; 17.856 and 20.000 mA.
The sequence used depends on the test objective and calibration procedure. Additional points should cover operating points important to the process and the region around the low-flow cutoff. The table does not prescribe a universally applicable number of calibration points. Where verification in accordance with DKD-R 6-1 has been agreed, its procedural requirements must also be met.
5. Distinguish What Each Test Establishes
Separate testing is intended to narrow down the cause of a deviation. For each test block, the stages actually included and those bypassed are therefore recorded.
| Test Block | Reference and Observed Value | What It Establishes and Its Limitations |
|---|---|---|
| Pressure input | Compare the reference pressure with the digital pressure variable of the device under test | Assesses pressure measurement; does not test the physical current output |
| Current output | Command a fixed current and measure the current actually flowing | Assesses the output stage and the included section of the loop; tests neither the pressure sensor nor square root extraction |
| Calculation function | Compare a defined or read-back input value with the digital output calculated from it | Verifies the accessible signal processing; the exact injection and observation points determine the scope |
| Device path with square root extraction | Apply a real pressure or electrical input and measure the physical output | Assesses the combined operation of the input stages, transfer characteristic and output stage |
| Downstream measurement path | Inject a reference current at the defined interface and check the PLC value | Assesses the chain from the injection point onwards; a bypassed transmitter remains outside the scope of verification |
Not every device provides all internal variables or simulation functions. If the calculation function can only be tested together with the sensor, that exact scope is documented. Opposing deviations in individual stages are also possible: an apparently good overall result can conceal errors in separate stages.
6. Record the Configuration and As-Found Condition
Before the first intervention, record the measurement point tag, device type, serial number and relevant software versions. Also record the pressure range, flow assignment, current characteristic, variable assignment, damping, cutoff settings, output limits and scaling in the downstream processing system. For compensated calculations, their parameters are included as well.
The first test series records the as-found condition in the defined test arrangement. It is performed before a sensor trim, current output adjustment or any change to settings relevant to the transfer behaviour. In particular, square root extraction should not be disabled before this as-found recording simply because a linear characteristic is easier to test.
The operating modes required for the following partial tests are then deliberately activated and recorded. The test plan specifies when normal processing will be restored. If the device is connected to the plant, the effects of test currents, simulated measured values and suspended alarms must be coordinated with plant operations beforehand. The as-found record also states whether testing took place on site or under laboratory conditions after removal.
7. Select a Suitable Pressure Reference
The pressure reference must be suitable for the smallest relevant test points. A high maximum measuring range is not an indicator of quality for a small differential pressure span. The decisive factors are uncertainty in the range actually used, resolution, zero-point behaviour, temperature dependence, drift and the pressure transmission medium.
In the example with a full-scale value of 100 mbar, 10 % flow corresponds to only 1 mbar differential pressure. If this region is to be assessed, pressure generation and the reference must be sufficiently stable and sensitive at that level. A reference specified solely as a percentage of its own full-scale value may be inadequate when only a small part of its span is used.
A distinction must also be made between the differential pressure range and the permissible static pressure. A low-pressure reference with two pressure connections is not automatically suitable for high common pressure on both sides. A test arrangement with the low-pressure side at atmospheric pressure represents a different operating condition from testing under high line pressure. The possible effect of static pressure on the device under test must be considered according to the application.
8. Set Up the Pneumatic Test Arrangement
For a suitable pneumatic workshop test, the transmitter is isolated from the process, depressurised and pressurised with a compatible test medium. The pressure source and reference are connected so that the pressure at the high-pressure connection of the device under test is known and can be substantiated. The low-pressure connection is exposed to the defined reference condition, usually ambient pressure for a test at atmospheric pressure.
When a differential pressure reference is used, its two connections must be assigned to the same relevant pressure conditions as H and L on the device under test. A measurement point connected through a valve manifold also requires clearly defined valve positions. An open equalising path can short-circuit the applied differential pressure. Residual pressure, trapped liquid or a blocked low-pressure side changes the test condition.
Short, suitable lines and leak-tight connections make stabilisation easier. Differences in pressure reference height must be minimised or corrected. In particular, a liquid column in a supposedly dry line can create a significant offset. Leak tightness is checked before the measurement series; all components must be suitable for the pressure, medium and loads applied to their connections.
9. Connect the Current Loop and Communication
A two-wire transmitter requires a suitable loop power supply and calibrated current measurement. The ammeter is connected in the intended current path. If an external power supply is already in use, the calibrator’s internal loop power supply must not inadvertently be switched on as well. The permissible load, cable resistance and minimum voltage at the transmitter must also be taken into account at high output currents.
HART additionally requires a communication solution that matches the device configuration. The required loop impedance and existing resistors are checked against the connection arrangement. An integrated HART resistor is not in itself a HART communicator. The communication solution must support the required variables and methods of the specific device under test.
Electrical input tests distinguish between active current sourcing and simulation of an externally powered two-wire device. The connected input determines the appropriate operating mode. If a calibrator is connected in place of the transmitter, verification begins at this injection point. Further connection details are covered in the article Testing a 2-Wire Transmitter with a Process Calibrator.
10. Plan Stabilisation and Data Acquisition
After power-up and after pressure changes, the reference and the device under test must reach a suitably stable state. This involves the device-specific warm-up time, temperature equalisation, settling of the pressure system and the configured signal filtering. A fixed, short waiting time is not automatically sufficient for different pressure volumes and damping settings.
Preloading, measurement sequence, hold times and repetitions are derived from the selected calibration procedure. Ascending and descending sequences allow behaviour on reversal and hysteresis to be assessed. The measured values should be sufficiently stable over a defined observation period; the acceptance criterion depends on the required uncertainty.
The assessment uses the actual measured reference pressure, not just the setpoint on the pressure controller. Pressure, the digital device value and current are recorded with appropriate time alignment. Otherwise, a slowly drifting pressure combined with delayed readings can produce an apparent deviation from the transfer characteristic. A steady display alone does not demonstrate sufficient stability of the entire setup.
11. Calibrate the Input Stage
For the separate pressure test, the reference pressure is compared with an accessible digital pressure variable from the transmitter. This variable must belong to the pressure measurement stage and must not already be scaled as flow rate. Its unit, resolution and update behaviour are recorded in the test report.
The pressure deviation is the differential pressure reported by the device under test minus the reference value. Evenly spaced pressure points make it easier to assess zero, span and response across the range. The pressure reference may require a correction to the reference level of the device under test.
If no suitable digital pressure value is available, a linear output configuration provided by the manufacturer can help with diagnosis. This requires an as-found measurement series to have already been recorded and the current output stage to have been assessed separately. Without this separation, the linear result still includes the output deviation. The intended operating transfer characteristic is then restored.
For an electrical square root extraction converter, the calibrated current source replaces the pressure reference. An internal input value can only be assessed separately if the device makes it accessible. Otherwise, the electrical input processing is tested together with the subsequent calculation function.
12. Test the Actual Current Output Separately
A loop test provided by the manufacturer can set the output stage to a fixed current. Practical test points include, for example, 4, 12 and 20 mA, supplemented by further values according to the test requirements. The requested current is compared with the calibrated current measurement.
The pressure sensor does not determine the output in this operating state. A deviation in the actual current output can therefore be distinguished from incorrect pressure measurement. If the deviation persists only at high currents, the supply voltage and load must be checked as well as the output stage.
The digitally read HART output value is often only the internal representation of the calculated expected current. It does not replace a physical current measurement. For example, the device may digitally report 12.000 mA while a different current flows in the circuit. For the comparison, it must be clear whether the calibrator displays a value reported by the transmitter or a current it has measured itself.
After the output test, the fixed-current function is ended and the return to an output that depends on the measured value is checked. Otherwise, a forgotten test mode can leave a measurement point that appears stable but is disconnected from its input.
13. Verify the Square Root Function Separately
The calculation function can be tested most clearly if the device can simulate a defined input value before square root extraction and provide the calculated value before the analogue output stage. The injection point must be documented in the manual: a forced output current bypasses the square root calculation and is unsuitable for this purpose.
If no corresponding simulation is available, the pressure reading and the digital output calculated from it can be compared. In the example, an internal pressure value of 25.00 mbar with a full-scale value of 100 mbar must produce 50 % or an expected current of 12.00 mA outside the cutoff region. This checks the mathematical consistency of the accessible path. Whether the pressure value itself is correct still requires comparison with the pressure reference.
For a separate electrical square root extraction module, currents of 4, 5, 8, 13 and 20 mA are injected, for example. The ideal outputs are 4, 8, 12, 16 and 20 mA. If digital intermediate values are unavailable, this test also includes the electrical input and output conversion. The result is accordingly described as a test of the complete module.
For calibrators with a “Flow Rate” or “Flow” function, the meaning of the percentage display must be established. Depending on the operating mode, 50 % may mean 12 mA as a current signal linear with flow rate or 8 mA as the corresponding current signal linear with differential pressure. The test plan therefore always specifies the actual expected mA values.
An enabled SQRT analysis function in the calibrator, however, may merely determine the expected-value calculation for comparison with the device under test. In that case, it does not constitute additional square root extraction in the process signal. A distinction must be made between the transfer characteristic of the generated test signal and the calculation function that the calibrator uses to assess the result.
14. Test the Complete Chain and Downstream Scaling
Testing the device path with square root extraction reconnects the actual input to the physical output. In the example, the pressure points are applied and the output current is compared with the expected value calculated from the measured reference pressure. If the scope includes the measurement chain through to the PLC, its raw value, scaled flow rate and displayed value are also recorded.
A particularly informative intermediate point is 25 % differential pressure. This ideally produces 50 % flow rate. If square root extraction is entirely absent, a correspondingly linear scaling in the evaluation system displays only 25 %. If square root extraction is applied twice, the result is approximately 70.71 %. These values are diagnostic indicators for the simple normalised model; additional scaling errors can change the pattern.
For a separate PLC test, current is injected at the agreed interface point. If the PLC already expects a current signal linear with flow rate, 12 mA corresponds to half the flow range. If it expects a current signal linear with differential pressure and performs square root extraction itself, 8 mA corresponds to half the flow range. The test must reproduce exactly the interface intended for operation.
15. Account for Low-Flow Cutoff and Damping
Near zero, the sensitivity of the square root function increases sharply. Many devices therefore use a low-flow cutoff, a linear transition region or a combination with hysteresis. The ideal equation I = 4 mA + 16 mA · √x does not apply throughout this region.
Before testing, the threshold, reference basis and behaviour below the threshold are established. A value of 1 % differential pressure corresponds to 10 % flow rate in the ideal model. A setting of 1 % flow rate has a different meaning. It is also necessary to check whether the function acts on the analogue output, the display or both paths.
The measurement series includes values below, above and, where applicable, within the transition region. If hysteresis is present, the boundary is approached from both directions. Assessment is against the documented device function. A flow rate set to zero in accordance with the configuration is not evidence of incorrect square root extraction.
For an additional test of the ideal transfer characteristic, the cutoff can be changed in a documented diagnostic state. The final test is performed with the intended operating settings. Damping is considered separately: it affects settling behaviour and can cause an apparent static deviation if readings are taken too early.
16. Assess Measurement Deviations Using the Correct Reference Basis
For the pressure stage, the deviation is stated in a pressure unit or relative to the defined pressure span. For the output with square root extraction, the following applies to a 4 … 20 mA signal that is linear with flow rate:
eI = Imeasured − Iexpected
eQ,span = eI / 16 mA · 100 %
At a reference pressure of 25.00 mbar, the expected current in the example is 12.000 mA. If 12.032 mA is measured, the resulting deviation is +0.032 mA or +0.2 % of the flow span. For a range of 0 … 100 m³/h, this corresponds to +0.2 m³/h and, at the operating point of 50 m³/h, a relative deviation of +0.4 %.
Here, the relative flow rate deviation is referenced to the usable signal component Iexpected − 4 mA. Dividing by the total current value or by 20 mA uses a different reference basis. At zero flow, a relative deviation with respect to the flow rate is undefined; absolute quantities or percentages of span are used instead.
Nor may an unchanged percentage flow tolerance be derived from a permissible pressure deviation. The conversion depends on the operating point and the transfer characteristic that is actually active.
17. Propagate Measurement Uncertainty Through Square Root Extraction
The uncertainty of the determined output deviation requires consideration of at least the pressure reference, the current measurement and the repeatability of the test procedure. Further contributions may include pressure stability, reference drift, resolution, temperature and a correction for the pressure reference elevation. Contributions already included in an observed scatter or in a combined reference uncertainty are not added again.
In the ideal square root region, the transfer characteristic gives the following sensitivity coefficient with respect to differential pressure:
cp = ∂Iexpected / ∂Δp = 8 mA / √(Δpmax · Δp)
With an upper range value of 100 mbar, the factor at the 25 mbar test point is still 0.16 mA/mbar. At the 1 mbar test point, it is 0.8 mA/mbar. The same pressure uncertainty contribution therefore has five times the effect on the calculated expected current at that point.
A simplified numerical example assumes the following mutually independent standard uncertainties at the 1 mbar test point: up = 0.010 mbar for the applied reference pressure, uI = 0.003 mA for the current measurement and ur = 0.002 mA for an additional measured repeatability contribution. These values are freely chosen assumptions for the calculation and are not specifications of any product mentioned.
uc(eI) = √[(cp · up)² + uI² + ur²]
uc(eI) ≈ 0.00877 mA
U = 2 · uc ≈ 0.0175 mA
With the coverage factor k = 2 chosen here, this corresponds to approximately 0.11 % of the flow span. Since 1 mbar represents only 10 % flow in this example, it is approximately 1.10 % relative to that flow rate. The actual overall uncertainty requires a complete model of the specific test setup; possible correlations and other relevant contributions must be taken into account.
This derivative does not apply at zero. The linear approximation may also be insufficient at cutoff boundaries or where the pressure uncertainty is large relative to the input. In such cases, the actual piecewise transfer characteristic must be assessed using an appropriate nonlinear uncertainty evaluation.
18. Separate the Tolerance Decision, Adjustment and Final Verification
A calibration determines the relationship between the reference and the indication, including the uncertainty. An adjustment changes the device. Setting the measuring range, square root extraction or damping is a configuration change. These operations are documented separately even if the device software uses similar menu labels for them.
The permissible deviation, reference basis and decision rule are defined before the assessment. For a symmetrical tolerance ±T, it may, for example, be agreed that a result is accepted only if |e| + U ≤ T. This acceptance rule with a guard band is one possible agreement, not a universally prescribed rule. If its acceptance condition is not met, further classification follows the decision rule agreed in full.
Any required sensor trim is performed against a suitable pressure reference. An analogue or DAC trim corrects the current output using the current reference. An incorrect pressure span or double square root extraction is remedied by correcting the relevant configuration. The intervention must address the demonstrated cause.
This is followed by as-left verification covering the intended scope, including relevant intermediate points and special regions. Finally, the operating settings, variable assignment and normal output dependent on the measured value are checked. Adjusted endpoints alone do not confirm the transfer characteristic between those points.
Simulations and forced PLC values are also removed before the device is returned to service. Temporarily suspended alarm and protective functions are reactivated in accordance with the site’s release procedure.
19. Systematically Distinguish Typical Faults
The following overview uses the simple model with a zero-based pressure range. Observations initially provide an indication of what to test. The cause is then confirmed by the appropriate individual test.
| Observation | Possible Cause | Useful Test |
|---|---|---|
| 0 and 100 % are correct, but at 25 % Δp only 25 % flow is indicated | Square root extraction is missing from the intended signal path | Check the transmitter’s transfer characteristic and the processing in the downstream system |
| At 25 % Δp, approximately 70.71 % flow is indicated | Double square root extraction | Compare digital intermediate values, the current transfer characteristic and the PLC function separately |
| The digital pressure value is correct, but the physical output current also deviates during the fixed-current test | Output adjustment, supply or load | Check the current reference, loop voltage and output stage |
| The current output passes the fixed-current test, but the digital pressure value deviates | Pressure sensing, zero point, test setup or static pressure effect | Check the reference pressure and pressure reference plane; then assess the input stage |
| Only low flow rates remain at zero or follow a different transfer characteristic | Cutoff, linear transition or incorrect interpretation of thresholds | Read out the actual special transfer characteristic and its reference basis |
| Rising and falling values differ; the difference decreases with a longer waiting time | Damping, insufficient stabilisation or dynamic pressure equalisation | Check the hold time and timing of the readings; assess any remaining hysteresis separately |
| The calibrator shows plausible percentages, but the expected mA values do not match | Unsuitable linear or flow-related calibrator mode | Check the normalisation and the mA values actually measured or output |
| The device output is correct, but the control system indication deviates | Input card, scaling, additional calculation function or filtering | Inject a reference current at the defined handover point and test the downstream path |
20. Document Results Reproducibly
A verifiable record contains more than a list of expected and actual currents. It first describes the device under test and the signal path tested. This includes units, pressure and flow ranges, the location of square root extraction, variable assignment, active special transfer characteristics and the extent of the measurement chain included.
For each test point, the reference input, observed digital values, actually measured output, calculated expected value, deviation and uncertainty are recorded. The direction of approach, repeat measurements and, where applicable, the stabilisation criterion make differences between measurement series understandable. For electrical simulation, the injection point is documented.
The setup description includes the pressure medium, reference planes, mounting orientation, relevant ambient conditions, static test pressure, loop supply and load. Reference instruments are identified and linked to the calibration records used for pressure or current respectively. Traceability and uncertainty must match the channels and ranges actually used.
As-found results, interventions performed and as-left results remain distinguishable. The report states the tolerance and decision rule applied, as well as limitations, such as an operating pressure dependence that was not assessed. Automated test templates also require controlled assignment of the transfer characteristic, percentage basis and device configuration so that a saved procedure does not start with incorrect expected values on the next device.
21. Suitable Calibration Equipment from ICS Schneider
Druck DPI620G: Modular System for Pressure, Current and Communication
The Druck DPI620 GENII combines electrical measurement and sourcing functions with a modular, expandable pressure system. HART communication is available depending on the version. This allows a setup to be assembled for comparing reference pressure, the digital device value and the actual output current. The available HART methods also depend on the connected transmitter.
For small differential pressure spans, suitable pressure modules and finely controllable pressure generation are crucial. The IO624-LPA low-pressure accessory complements a system comprising the PV624, DPI620G and a suitable reference for this purpose. It is not a complete calibrator on its own. For the specific PM620LP modules, the manufacturer’s data sheet states a maximum static pressure of 250 mbarg. This value is specific to the module and limits the permissible common pressure loading.
Druck DPI610E: Portable Pressure Testing with HART Functions
The DPI610E and DPI610E-IS pressure calibrators support portable pressure and electrical testing. The HART functions allow, among other things, a loop test and comparison of digitally reported values with the actually measured loop current. This supports separate assessment of the input stage and current output. For the specific differential pressure test, the reference range, uncertainty and pressure connections must suit the measurement task; the device designation alone does not establish suitability for every low-pressure span or every static test pressure.
Druck UPS4E: Testing the Electrical Section and Setting Defined Currents
The Druck UPS4E current loop calibrator is suitable for measuring and sourcing current signals and for testing an electrical square root extraction module or the downstream PLC input. Linear and flow-related displays support suitable test procedures, but require a clearly defined percentage basis. The documented flow-related sequence of 0, 25, 50, 75 and 100 % uses 4, 5, 8, 13 and 20 mA as an input representation that is linear with differential pressure.
The UPS4E does not generate test pressure. Its integrated, selectable 250-Ω HART resistor supports suitable external communication but does not replace a HART communicator. The required current operating mode, loop supply, accuracy and division of tasks with the pressure calibrator are therefore decisive for selection.
22. Conclusion: Every Test Value Needs a Clearly Defined Signal Path
Flow transmitters with square root extraction can be assessed reliably when testing makes the physical input signal, mathematical transfer and actual output visible separately. Suitable intermediate points are essential for this. A fixed-current test assesses a different section from a pressure calibration; calculation from digital intermediate values answers a separate diagnostic question.
The greatest measurement challenge often lies in the lower flow range. Here, a small differential pressure is involved, the square root function increases sensitivity to pressure uncertainty and a special transfer characteristic may change the expected behaviour. The reference, test point sequence and evaluation must collectively account for these relationships.
Clarify the signal path → Preserve the initial state → Define references and test points → Test the input, calculation function and output separately → Assess the complete chain → Document interventions and the final state
The most important practical principle is therefore: A passed test point is only meaningful if it is known which input signal was applied, which function was active and which output was actually measured.
23. Frequently Asked Questions About Calibration with Square Root Extraction
23.1 Are 4 and 20 mA Sufficient as Test Points?
The endpoints are not sufficient to assess the square root function. In the ideal normalised model, linear transfer characteristics and those with single or double square root extraction coincide at 0 and 100 %. Intermediate points must form part of the corresponding functional verification.
23.2 What Differential Pressure Corresponds to 12 mA?
For a 4 … 20 mA output signal that is linear with flow rate, 12 mA represents 50 % flow rate. In the ideal model with a zero-based range, this corresponds to 25 % differential pressure. For a range of 0 … 100 mbar, this is 25 mbar. Other transfer characteristics or output assignments require separate calculations.
23.3 Why Can an 8 mA Input Produce a 12 mA Output?
An 8 mA input that is linear with differential pressure, after subtraction of the 4 mA offset, corresponds to 25 % of the input span. Its square root is 50 %. Transferred to the output range, this gives 4 mA plus 50 % of 16 mA, which is 12 mA.
23.4 Are Evenly Spaced Pressure Steps Incorrect?
They can be used to test the pressure measurement stage and also to verify the transfer characteristic. However, the expected output values must be calculated using square root extraction. Evenly spaced flow rate steps, on the other hand, require quadratically distributed pressure points. The purpose of the test determines the appropriate sequence.
23.5 Does Reading Values via HART Already Constitute Calibration?
Reading values alone does not provide a comparison with a traceable reference. HART can make variables and settings accessible and initiate test methods. A metrological assessment additionally requires suitable pressure or current references and a documented evaluation.
23.6 Must Square Root Extraction Be Switched Off Before Calibration?
The initial test should cover the intended signal path or the signal path as found. A linear operating mode may be useful for additional diagnosis. Any such change is documented and made after the as-found results have been recorded; the operating settings are then restored and checked.
23.7 Does a Current Simulator Also Test the Pressure Sensor?
Injecting current downstream of the transmitter does not test the pressure sensor. It assesses the connected electrical path from the injection point onwards. To assess pressure measurement, a defined pressure must act on the sensor and be compared with its response.
23.8 Can Differential Pressure Be Calculated from Two Gauge Pressure Measurements?
This is possible in principle if the measurement model and uncertainties are suitable. However, for a small difference between two large pressure values, the uncertainty of the difference may become too large. Resolution, correlation, simultaneous acquisition and static pressure conditions must be considered. Subtraction alone does not make two instruments a suitable differential pressure reference.
23.9 How Is an Elevated Lower Pressure Range Value Handled?
The specific instrument equation and the relationship between pressure and flow rate are decisive. The square root of a signal normalised to a shifted pressure span does not automatically describe the physical flow transfer characteristic. Expected values must be calculated from the transfer function actually agreed upon.
23.10 How Are Bidirectional Flow Measurements Tested?
In addition to the magnitude, the direction or sign must be processed correctly. The zero point, forward and reverse ranges, their current assignments and transition behaviour are tested against the instrument-specific transfer characteristic. The simple positive square root function used in this calculation example is not sufficient for this purpose.
23.11 Why Does the Flow Rate Fluctuate Particularly Strongly Near Zero?
The square root function is sensitive to small pressure changes in this region. Pressure noise, an unstable zero point, leaks or residual liquid in test lines can therefore become clearly visible. The cause is first investigated in the pressure signal and the test setup; the intended filter and cutoff functions are then assessed.
23.12 Must the Low-Flow Cutoff Be Disabled for Verification?
Testing the operating state must include the intended cutoff. An additional test without this function can make it easier to diagnose the ideal transfer characteristic. The two states must be documented separately, as different expected values may apply to them.
23.13 At 50 %, Why Does the Calibrator Sometimes Show 8 Instead of 12 mA?
A flow-related source mode can generate the pressure signal value corresponding to 50 % flow rate. This is 25 % of the current span that is linear with differential pressure, and therefore 8 mA. An output signal directly linear with flow rate would instead be 12 mA. The function of the current signal and the definition of the calibrator mode are decisive.
23.14 Does 0 mA Mean Zero Flow?
In the 4 … 20 mA system considered here, the normal zero-flow point corresponds to 4 mA. A value of 0 mA may indicate, for example, a missing power supply or an interrupted loop. Fault, underrange and saturation signals are assessed according to the specific instrument configuration.
23.15 Does the Test Also Apply to Mass or Standard Volume Flow Rate?
Assessing the signal stages separately remains useful. However, if density, pressure, temperature or other quantities are used in the calculation, these inputs and the associated calculation rule form part of the extended test scope. A differential pressure test alone does not confirm their correctness.
23.16 How Often Should a Transmitter with Square Root Extraction Be Calibrated?
The interval depends on the operating conditions, required measurement quality, importance of the measurement point and previous calibration results. Drift, interventions, changed operating conditions or unusual measurement results may justify an earlier test. The square root extraction function alone does not establish a universally applicable interval.
23.17 What Information Makes a Calibration Record Useful for Quality Assurance?
A clearly defined test scope, traceable references, actual input and output values, the transfer characteristic used, measurement deviations and uncertainties are required. A statement of conformity must also include the tolerance and decision rule. As-found results, interventions and as-left results must be clearly distinguishable in the record.
23.18 What Information Does ICS Schneider Need for Selection?
Useful information includes the instrument type and signal variant, physical or electrical input, differential pressure range including the lowest relevant test points, static test pressure, pressure medium and connections. Also needed are the current operating modes, existing loop supply, HART requirements, location of square root extraction, cutoff behaviour, permissible deviation, required uncertainty and requirements for mobile testing, automation and documentation.