


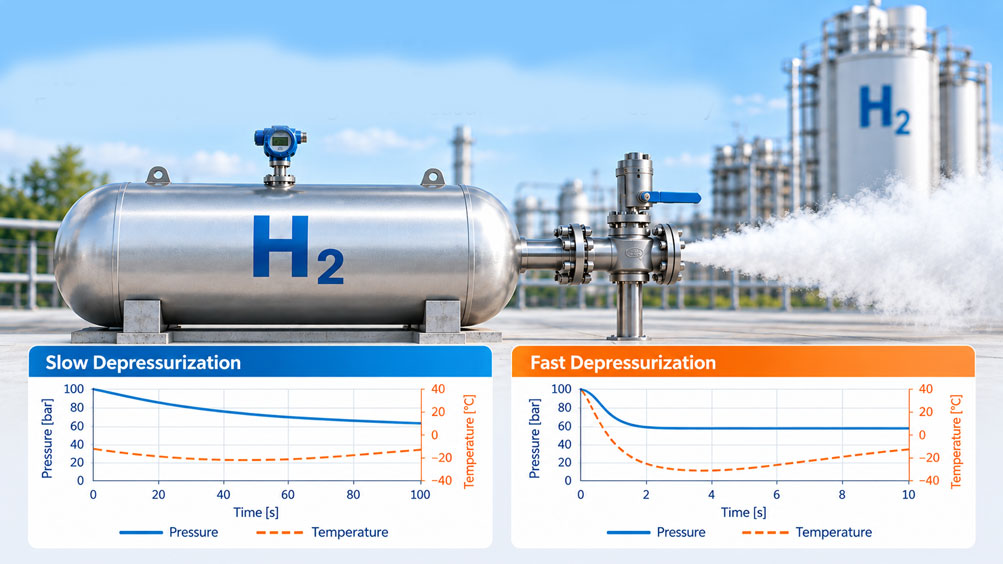
The pressure in a high-pressure hydrogen storage vessel is reduced using a specially designed depressurization system. The pressure transmitter indicates the expected pressure drop, but at the same time, the measured gas temperature decreases. After depressurization has ended, the temperature rises again and the pressure also changes, even though no additional hydrogen is supplied. At another measuring point near a pressure control valve, however, local heating is observed. Which of these effects is physically plausible, and when does the signal indicate a measurement error?
This question is particularly important for hydrogen storage systems, compressor stations, fuel cell test benches, electrolysis plants and H₂ infrastructure systems. Depressurization not only changes the operating pressure but can also affect temperature distributions, gas density, heat transfer and the mechanical loading of materials.
It is particularly important to distinguish between the cooling of the hydrogen remaining in the storage vessel and the Joule-Thomson effect during the throttling of a flowing gas. During rapid discharge, the hydrogen remaining in the vessel can cool significantly. At the same time, hydrogen has a negative Joule-Thomson coefficient at typical ambient temperatures, meaning that approximately isenthalpic throttling can cause a temperature increase.
These statements are not contradictory. They refer to different thermodynamic processes and different locations within the system.
The depressurization rate also affects the reliability of the pressure and temperature measurements. For example, a pressure transmitter may detect a pressure change faster than a slow-response temperature sensor can register the actual change in gas temperature. Long measuring lines, electrical filters and an excessively low sampling rate can also cause time-related distortions in the recorded signals.
Hydrogen introduces additional requirements. High numbers of pressure cycles, hydrogen permeation, possible hydrogen embrittlement, low local temperatures and special leak-tightness requirements must all be considered when selecting the measuring equipment.
This technical article explains the physical differences between slow and fast depressurization of gaseous high-pressure hydrogen. Using a transparent calculation example, it demonstrates why pressure alone is insufficient to evaluate the thermal condition of a storage vessel. It also covers measurement dynamics, temperature compensation, leak tightness, material selection, safety requirements and suitable H₂ measuring instruments.
The calculations presented are intended for interpreting measurement results. Designing and carrying out actual high-pressure hydrogen depressurization requires a separately verified safety and system design.
Table of Contents
- Measurement Tasks and Typical Problems During H₂ Depressurization
- Thermodynamic Fundamentals of High-Pressure Hydrogen
- Distinguishing the Joule-Thomson Effect from Storage Vessel Cooling
- Comparing Slow and Fast Depressurization
- Understanding Depressurization Rate and Influencing Factors
- Correctly Defining Measuring Points and Installation Conditions
- Selecting Pressure and Temperature Measuring Ranges
- Practical Example: Calculating Temperature Changes and Pressure Signals
- Interpreting Pressure Signals During and After Depressurization
- Temperature Signals, Sensor Response Time and Temperature Gradients
- Real Gas Behavior and the Limitations of Simplified Calculations
- Selecting Suitable Temperature Measurement Methods
- Hydrogen Compatibility, Permeation and Embrittlement
- Pressure Connections, Measuring Lines and Seals
- Sensor Bandwidth, Sampling Rate and Signal Filtering
- Correct Time-Based Evaluation of Pressure and Temperature Data
- Measurement Uncertainty and Thermal Measurement Errors
- Distinguishing Leakage, Pressure Changes and Temperature Equalization
- Explosion Protection and Safety-Related Limitations
- Systematic Testing and Commissioning Procedure
- Typical Fault Symptoms and Targeted Troubleshooting
- Suitable ICS Products for High-Pressure Hydrogen
- Conclusion: Evaluate Pressure and Temperature Together
- Frequently Asked Questions About H₂ Depressurization
1. Measurement Tasks and Typical Problems During H₂ Depressurization
Different types of pressure reduction can occur during the operation of a hydrogen system. These include controlled depressurization for maintenance and testing, normal pressure control operations and pressure reduction processes initiated by safety systems.
The corresponding pressure changes may follow different time profiles. From a measurement perspective, the decisive factor is whether the process takes place slowly or quickly relative to the system’s thermal equalization time.
A typical measurement task involves recording the pressure profile of a storage vessel during depressurization while simultaneously determining which thermal changes occur.
This raises several fundamental questions:
- How does the temperature of the hydrogen remaining in the pressure vessel change?
- What influence does heat exchange with the vessel wall have?
- Why can the pressure change again after depressurization has ended?
- What temperature occurs at a throttling point or pressure control point?
- How quickly must a pressure sensor respond?
- How can a genuine pressure transient be distinguished from a measurement artifact?
- Which components must be designed for low or changing temperatures?
- How do repeated pressure cycles affect materials and seals?
The measurement task must therefore go beyond simply recording the initial and final pressures.
Particularly on test benches, it is useful to record complete time-dependent measurement profiles. This allows the actual depressurization, the subsequent temperature equalization and any abnormalities in the measurement equipment to be analyzed separately.
The depressurization rate is not a universally applicable device characteristic. Whether a process is considered thermally slow or fast depends on the vessel volume, heat transfer, gas mass, vessel geometry and the time-dependent pressure reduction.
2. Thermodynamic Fundamentals of High-Pressure Hydrogen
Hydrogen is a compressible gas. Its density depends on pressure, temperature and its real thermodynamic behavior.
For an initial idealized analysis, the ideal gas equation can be used:
p · V = m · Rs · T
Here, p represents absolute pressure, V the gas volume, m the gas mass, Rs the specific gas constant and T the absolute temperature in Kelvin.
For a closed, rigid volume with constant gas mass, this gives:
p / T = constant
During depressurization, however, gas leaves the storage vessel. The gas mass decreases and the temperature may also change. The simple relationship between pressure and temperature is therefore no longer sufficient to determine the time-dependent behavior.
2.1 Mass and Energy in the Storage Vessel
During depressurization, hydrogen flows out of the vessel. Energy also leaves the system with the escaping gas.
The energy balance depends, among other factors, on how much heat enters through the vessel wall during depressurization.
During very rapid processes, this heat input may initially be small compared with the energy carried away by the gas. As a result, the temperature of the gas remaining inside the vessel can decrease.
During slower processes, more time is available for thermal equalization with the surroundings.
2.2 Heat Capacity and Thermal Equalization
Hydrogen has a comparatively high specific heat capacity on a mass basis. The heat capacity of the vessel wall and the heat transfer between the gas and the wall are also decisive for the temperature profile.
A large, heavy-walled pressure vessel responds thermally differently from a small, thin-walled measuring chamber.
The temperatures of the gas, vessel wall and surroundings are therefore not necessarily identical.
2.3 Absolute Pressure and Gauge Pressure
Thermodynamic calculations must use absolute pressures.
Gauge pressure, by contrast, describes the pressure difference relative to ambient pressure.
pabs = pgauge + pamb
At an ambient pressure of approximately 1 bar, a pressure of 100 bar absolute corresponds to a gauge pressure of approximately 99 bar.
This difference must be considered particularly when calculating pressure ratios, gas density and thermodynamic models.
3. Distinguishing the Joule-Thomson Effect from Storage Vessel Cooling
During hydrogen depressurization, different thermodynamic effects are often confused with one another.
In particular, the temperature change of a gas during throttling must not be equated with the temperature change of the remaining gas mass in a vessel being emptied.
3.1 Joule-Thomson Effect
The Joule-Thomson effect describes the temperature change of a real gas during approximately isenthalpic throttling.
The Joule-Thomson coefficient is defined as:
μJT = (∂T / ∂p)h
The subscript h indicates that the process is considered at constant specific enthalpy.
If the coefficient is positive, pressure reduction during isenthalpic throttling causes a temperature decrease.
If it is negative, the gas can become warmer during pressure reduction.
At typical ambient temperatures, hydrogen has a negative Joule-Thomson coefficient in the relevant gas-state range.
Approximately isenthalpic throttling of hydrogen can therefore lead to a temperature increase.
This is an important characteristic that distinguishes hydrogen from many other technical gases.
3.2 Cooling During Pressure Vessel Discharge
Discharging a pressure vessel is a different thermodynamic process.
The escaping gas carries energy out of the vessel. If insufficient heat enters from the surroundings during rapid depressurization, the remaining gas mass can cool down.
This cooling is possible even when hydrogen has a negative Joule-Thomson coefficient at a throttling point.
3.3 Temperature in the Emerging Gas Jet
The processes occurring in the flowing gas must also be considered.
Different pressure, temperature and velocity distributions can occur in a throttle, an accelerating flow and a freely expanding gas jet.
In particular, a distinction must be made between the static temperature of a rapidly flowing gas and its total or stagnation temperature.
A single temperature reading directly downstream of a depressurization point therefore cannot be interpreted without knowing the measuring location and flow conditions.
Crucial point: The Joule-Thomson effect, cooling of the gas remaining in the storage vessel and the local temperature of an accelerated gas jet describe different physical aspects. They must not be evaluated using the same simplified formula.
4. Comparing Slow and Fast Depressurization
The depressurization rate influences how much heat can be exchanged between the gas, the vessel wall and the surroundings.
With sufficiently effective heat transfer, slow depressurization approaches an isothermal process.
Fast depressurization, by contrast, may approach adiabatic vessel discharge over the period being considered.
In real systems, the actual processes often lie between these two idealized limiting cases.
| Feature | Slow Depressurization | Fast Depressurization |
|---|---|---|
| Thermodynamic approximation | Approximately isothermal with sufficient heat exchange | Approximately adiabatic vessel discharge when heat input during the process is low |
| Gas temperature in the storage vessel | Can remain close to ambient temperature | Can decrease significantly |
| Heat exchange | Has a greater influence on the temperature profile during depressurization | Is often limited during the short depressurization period |
| Pressure profile | Comparatively low rate of pressure change | High rate of pressure change possible |
| Temperature difference between gas and vessel wall | Often smaller with effective thermal coupling | Can temporarily become significantly larger |
| Measurement dynamics | Lower requirements for time resolution | Potentially high requirements for sensor, signal transmission and data recording |
| Signal interpretation | Thermal conditions are often closer to equilibrium | Pressure and temperature transients must be evaluated separately |
| Subsequent temperature equalization | Smaller under favorable conditions | Can cause significant pressure and temperature changes |
| Material loading | Pressure and temperature changes are distributed over time | Additional dynamic and thermal stresses are possible |
The terms slow and fast therefore do not represent fixed time intervals.
Depressurization over several seconds may need to be evaluated differently for a small gas volume than for a large high-pressure storage vessel.
For measurement evaluation, the ratio between depressurization time and thermal equalization time should therefore always be considered.
5. Understanding Depressurization Rate and Influencing Factors
The pressure profile during depressurization is determined by several characteristics of the system.
5.1 Vessel Volume and Gas Inventory
The vessel volume influences the gas mass present and the thermal coupling between the gas and the vessel wall.
At the same pressure and temperature, a larger volume contains more hydrogen.
At high pressures, however, real gas behavior must be considered when determining the actual gas mass.
5.2 Flow Conditions
The mass flow rate depends, among other factors, on pressure ratios, gas conditions and the geometry of the specially designed depressurization device.
At sufficiently large pressure ratios, critical or near-sonic flow may occur.
In this operating range, the mass flow behaves differently from fully subcritical flow.
A simple proportional relationship between differential pressure and mass flow rate is therefore not universally valid.
5.3 Heat Transfer
During depressurization, heat can be transferred from the vessel wall to the cooling gas.
Heat transfer depends, among other factors, on the surface area, flow conditions, vessel geometry and temperature differences.
For many applications, a time-dependent thermal model is therefore required.
5.4 Initial Temperature
A storage vessel containing hydrogen that has already cooled significantly has different initial conditions from a vessel at room temperature.
Previous compression or refueling processes can also influence the temperature distribution.
5.5 Pressure Control and Depressurization Profile
The pressure change is also influenced by the operation of the intended control or depressurization equipment.
The selection and adjustment of this equipment are part of the safety-related system design and must not be based solely on a desired measurement curve.
6. Correctly Defining Measuring Points and Installation Conditions
For a meaningful depressurization test, pressure and temperature must be measured at suitable locations within the system.
For example, a single pressure measurement at the storage vessel can describe the time-dependent vessel pressure but does not provide direct information about the temperature of the emerging gas jet.
6.1 Pressure Measurement at the Storage Vessel
Storage vessel pressure should be measured at a measuring point specifically provided for this purpose and suitable for hydrogen.
A pressure connection that is as direct as possible can reduce the risk of long and narrow measuring lines distorting the dynamic pressure profile.
The design must meet the requirements for pressure resistance, leak tightness, material compatibility and safety.
6.2 Temperature Measurement Inside the Storage Vessel
The actual gas temperature may differ from the temperature of the outer vessel surface.
An externally mounted temperature sensor initially measures the temperature of the respective surface rather than the temperature of the gas volume itself.
Direct temperature measurement in the gas requires an appropriately designed measuring point with a suitable thermowell, pressure-resistant connection and hydrogen-compatible materials.
6.3 Temperature Measurement Downstream of a Pressure Control Point
An additional temperature measurement downstream may be relevant when evaluating the local throttling process.
The flow velocity, sensor position and heat transfer at the measuring point must be taken into account.
A local temperature measurement downstream of a control point cannot automatically be equated with the average gas temperature inside the storage vessel.
6.4 Ambient Conditions and Vessel Wall
Additional temperature measuring points on the vessel wall and in the surroundings can help evaluate heat transfer.
For example, this makes it possible to determine whether the hydrogen becomes significantly colder than the vessel wall during depressurization.
The selection of measuring points must be based on a documented measurement concept.
7. Selecting Pressure and Temperature Measuring Ranges
For a high-pressure hydrogen application, selecting a pressure sensor solely based on its nominal measuring range is not sufficient.
The following factors are particularly important:
- Maximum permissible operating pressure at the measuring point.
- Normal operating pressure range.
- Possible pressure peaks and overpressure conditions.
- Expected rate of pressure change.
- Required measurement accuracy.
- Permissible medium and ambient temperatures.
- Hydrogen compatibility of all wetted components.
- Required electrical and mechanical connections.
- Signal behavior during overrange and fault conditions.
- Any required approvals for hazardous areas.
7.1 Measuring Range and Pressure Reference
An absolute pressure transmitter measures pressure relative to absolute zero pressure.
A gauge pressure transmitter measures pressure relative to ambient pressure or a reference defined by its design.
When selecting the device, the actual pressure reference required must be checked.
For thermodynamic calculations in particular, an unambiguous conversion to absolute pressure is necessary.
7.2 Temperature Range
During rapid depressurization, the gas temperature can fall below the initial temperature.
The temperature range of the measuring instrument must therefore cover not only normal operating conditions but also the transient temperatures expected in the complete system.
The permissible medium temperature, compensated temperature range and permissible ambient temperature of the pressure transmitter are not necessarily identical.
7.3 Pressure Resistance of the Complete Measuring Point
The pressure resistance of a sensor alone does not determine the pressure resistance of the complete measuring point.
Process connections, adapters, seals, measuring lines and other components each have their own permissible operating conditions.
The lowest relevant limit within the complete, safety-assessed assembly must be taken into account.
8. Practical Example: Calculating Temperature Changes and Pressure Signals
A test bench is equipped with a rigid storage vessel for gaseous hydrogen. Using a simplified thermodynamic analysis, the aim is to investigate how the gas temperature differs during the same pressure reduction under approximately isothermal conditions and an idealized adiabatic discharge process.
In addition, the current signal that would be produced by a linearly scaled pressure transmitter is calculated.
8.1 Initial Data and Assumptions
The following explicitly selected assumptions apply to the calculation:
- Gas: hydrogen in a single-phase gaseous state.
- Initial pressure: p1 = 100 bar absolute.
- Pressure considered after depressurization: p2 = 80 bar absolute.
- Initial temperature: T1 = 20 °C = 293.15 K.
- Rigid vessel volume.
- For the fast limiting case: idealized adiabatic vessel discharge model.
- Ideal gas with a constant isentropic exponent κ = 1.4 as a calculation assumption.
- For the slow limiting case: approximately constant gas temperature.
- Linear absolute pressure measuring range of 0 to 100 bar with a 4 to 20 mA output.
The assumed ideal gas equation only approximates the real behavior of hydrogen at elevated pressures.
The numerical values are intended exclusively to compare two idealized limiting cases. They must not be used as actual temperature predictions or as a basis for sizing depressurization equipment.
8.2 Slow Depressurization – Isothermal Approximation
With sufficient heat transfer, the gas temperature can remain approximately constant during slow depressurization.
For the idealized isothermal case:
T2 = T1
This gives:
T2 = 293.15 K
T2 = 20 °C
In this idealized analysis, the temperature change is:
ΔT = 0 K
The pressure still decreases because hydrogen mass is removed from the storage vessel.
8.3 Fast Depressurization – Idealized Adiabatic Vessel Model
For a rigid, perfectly mixed vessel containing an ideal gas, with negligible heat input, no inflow and outgoing gas at the instantaneous vessel state, the unsteady mass and energy balance gives:
T2 / T1 = (p2 / p1)(κ – 1) / κ
This formula is used here for the idealized vessel discharge model. It is not a universally applicable description of arbitrary high-pressure throttling.
Using the assumed isentropic exponent κ = 1.4:
(κ – 1) / κ = 0.4 / 1.4 = 0.2857
The pressure ratio is:
p2 / p1 = 80 / 100 = 0.8
Therefore:
T2 = 293.15 K · (0.8)0.2857
T2 ≈ 275.04 K
Conversion to degrees Celsius:
T2 = 275.04 K – 273.15 K
T2 ≈ 1.89 °C
The resulting temperature change is:
ΔT = 275.04 K – 293.15 K
ΔT ≈ -18.11 K
In this idealized limiting case, the gas temperature therefore decreases by approximately 18 K.
8.4 Calculate the Pressure Transmitter Signal
For a linearly scaled absolute pressure transmitter with a measuring range of 0 to 100 bar and an output signal of 4 to 20 mA, the following applies:
I = 4 mA + 16 mA · (p – pmin) / (pmax – pmin)
At the initial pressure of 100 bar:
I1 = 4 mA + 16 mA · 100 / 100
I1 = 20.00 mA
At a pressure of 80 bar:
I2 = 4 mA + 16 mA · 80 / 100
I2 = 16.80 mA
The signal therefore decreases by:
ΔI = -3.20 mA
In an ideal linear and adequately temperature-compensated measurement model, the output signal for the same actual pressure is independent of whether depressurization occurs slowly or quickly.
In actual measurements, however, dynamic and thermal influences can cause additional deviations.
| Parameter | Slow Depressurization | Fast Depressurization |
|---|---|---|
| Initial pressure | 100 bar abs. | 100 bar abs. |
| Final pressure considered | 80 bar abs. | 80 bar abs. |
| Initial temperature | 293.15 K / 20 °C | 293.15 K / 20 °C |
| Thermodynamic assumption | Isothermal limiting case | Adiabatic, perfectly mixed vessel model |
| Calculated gas temperature at 80 bar | 293.15 K / 20 °C | 275.04 K / 1.89 °C |
| Temperature change | 0 K | Approx. -18.11 K |
| Current signal at 100 bar | 20.00 mA | 20.00 mA |
| Current signal at 80 bar | 16.80 mA | 16.80 mA |
| Important interpretation | Heat exchange keeps the gas temperature approximately constant | Energy removal can cool the remaining gas mass |
8.5 Temperature Equalization After Depressurization
After rapid depressurization has ended, the initially cooled gas can warm up again due to heat transfer from the vessel wall and the surroundings.
If the vessel is subsequently closed and no further hydrogen mass enters or leaves, the pressure can rise again during this warming process.
For an idealized closed, rigid volume with constant gas mass:
p3 / p2 = T3 / T2
This relationship demonstrates why a subsequent pressure increase does not necessarily indicate a leaking shut-off valve or additional gas supply.
However, the actual magnitude of the pressure increase depends on the temperature development, real gas behavior and boundary conditions.
8.6 Limitations of the Calculation Example
For high-pressure hydrogen, the ideal gas equation and constant heat capacities are only approximations.
For technical design, the real equation of state, actual gas mass, vessel material, heat transfer and flow characteristics must be considered, among other factors.
The local temperature at a throttling point also cannot be determined from the simplified vessel equation.
The calculation example therefore illustrates the direction and potential significance of thermal effects but does not replace a validated high-pressure hydrogen simulation.
9. Interpreting Pressure Signals During and After Depressurization
A pressure transmitter measures the local pressure at its process connection.
During rapid depressurization, pressure may develop differently at different locations within a system.
Time-dependent pressure differences may exist between the storage vessel, piping, valve and downstream system.
9.1 Actual Process Pressure
The measured pressure drop may be directly attributable to the decreasing gas mass inside the storage vessel.
At the same time, the temperature may also change. A complete description of the gas state therefore requires both measured variables.
9.2 Thermal Influence on the Pressure Sensor
A rapid temperature change can subject the sensor to thermal stress.
Depending on its design and compensation, temporary zero-point or sensitivity deviations may occur.
Such influences must be distinguished from an actual change in process pressure.
9.3 Pressure Increase After Closing
If depressurization has ended, the gas mass remains constant and the initially cooled gas warms up again, the pressure can increase.
This effect is frequently overlooked during troubleshooting.
A pressure increase after depressurization must therefore not be interpreted as an impermissible additional gas supply without considering temperature.
9.4 Unusual Pressure Peaks
Short pressure peaks may result from actual flow processes or from the dynamic characteristics of the measuring arrangement.
Factors such as sensor bandwidth, line resonance, electrical filtering and time-based sampling must be considered during evaluation.
A fast pressure transmitter alone does not guarantee undistorted recording of the complete process.
10. Temperature Signals, Sensor Response Time and Temperature Gradients
A temperature measurement does not necessarily represent the actual gas temperature without a time delay.
The measured temperature depends on the thermal contact between gas and sensor, the mass of the sensing element, its installation and heat transfer.
10.1 Dynamic Delay
A temperature sensor has a finite response time.
If the gas temperature changes significantly within a short period, the sensor signal may follow this change with a delay.
During rapid depressurization, the pressure signal may therefore already have decreased considerably while the temperature sensor indicates only part of the actual temperature change.
10.2 Influence of the Thermowell
A thermowell mechanically and chemically separates the sensing element from the process medium.
It may be necessary for safe installation but often increases thermal mass and therefore response time.
For dynamic measurement tasks, the complete combination of temperature sensor, thermowell and installation conditions must therefore be evaluated.
10.3 Difference Between Gas and Wall Temperature
The temperature of the vessel wall may change more slowly during rapid depressurization than the gas temperature.
An external contact sensor therefore measures a different thermal condition from a sensor positioned in the gas.
Both values may be important for evaluation, but they must not be confused with one another.
10.4 Spatial Temperature Distribution
During depressurization, the temperature within the storage vessel may vary spatially.
Depending on vessel geometry, flow and heat transfer, temperature gradients may develop.
A single temperature measuring point may therefore not represent the average gas temperature of the entire storage vessel.
11. Real Gas Behavior and the Limitations of Simplified Calculations
At elevated hydrogen pressures, significant deviations from ideal gas behavior may occur.
For a more accurate description, the real gas compressibility factor Z is frequently used:
p · V = Z · m · Rs · T
The compressibility factor depends on pressure and temperature.
A suitable thermodynamic property model or validated equation of state is therefore required when designing a high-pressure hydrogen system.
11.1 Density and Remaining Gas Mass
Density can be described approximately using the compressibility factor as follows:
ρ = p / (Z · Rs · T)
This demonstrates that the same pressure reading at different temperatures does not automatically correspond to the same gas mass inside the storage vessel.
In addition, the compressibility factor changes with the thermodynamic state.
11.2 Variable Heat Capacities
The isentropic exponent κ used in simplified calculations cannot be assumed to remain constant for all pressure and temperature conditions.
In a real thermodynamic calculation, the corresponding thermophysical properties must be taken into account.
11.3 Flow and Heat Transfer
During rapid depressurization, unsteady flows, temperature gradients and time-dependent heat transfer may occur.
A perfectly mixed vessel model may then be insufficient.
More comprehensive thermodynamic models or numerical simulations may be required for demanding applications.
11.4 Applying the Joule-Thomson Coefficient
The Joule-Thomson coefficient depends on the respective thermodynamic state of the gas.
A single coefficient must therefore not be applied to an arbitrarily large pressure change without verification.
The actual thermodynamic path must be considered, particularly at high pressures.
12. Selecting Suitable Temperature Measurement Methods
Depending on the application, resistance thermometers, thermocouples and other suitable temperature measurement systems can be used for temperature monitoring in hydrogen systems.
The choice depends primarily on the required temperature range, dynamic response and design of the measuring point.
12.1 Resistance Thermometers
Pt100 and Pt1000 resistance thermometers are suitable for numerous industrial temperature measurement tasks.
For example, they can be used to monitor the temperature of a storage vessel, a pipeline or a suitable process measuring point.
The decisive factors are the permissible temperatures, measurement uncertainty and mechanical and thermal design.
12.2 Thermocouples
Thermocouples may be suitable for dynamic measurements if the complete configuration provides an appropriate response time.
However, the actual response speed depends significantly on the design, diameter, installation conditions and thermal contact.
A thermocouple is not automatically faster than every resistance thermometer simply because of its measuring principle.
12.3 Temperature Measurement with a Thermowell
In a pressurized hydrogen pipeline, a thermowell may be required to separate the sensing element from the process.
The suitability of the thermowell must be verified for the actual pressure, temperature, hydrogen compatibility and mechanical loading.
The specified temperature limit of the sensor must not be equated with a pressure approval for the complete temperature measuring point.
12.4 Dynamic Selection Criteria
For fast temperature measurement, the following characteristics in particular should be known:
- Measuring range and permissible temperature limits.
- Response time of the complete measuring arrangement.
- Thermal contact with the medium.
- Wall and heat conduction errors.
- Measurement uncertainty over the relevant temperature range.
- Materials, pressure connections and sealing concept.
- Any required hazardous-area approval.
Selection should always be based on the specific measuring point.
13. Hydrogen Compatibility, Permeation and Embrittlement
Hydrogen can affect the properties of certain materials. This aspect is particularly important in high-pressure applications.
The hydrogen compatibility of a component depends, among other factors, on the material, microstructure, strength, temperature, pressure and mechanical loading.
13.1 Hydrogen Embrittlement
Under certain conditions, hydrogen can reduce the resistance of metallic materials to cracking and fracture.
Mechanical stresses, material condition and repeated loading caused by pressure cycles are particularly relevant.
Selecting a suitable alloy alone therefore does not replace an assessment of the complete design.
13.2 Hydrogen Permeation
Under suitable conditions, hydrogen can diffuse through certain materials.
In pressure sensors with media-isolated designs, this may be relevant, for example, to diaphragms, fill fluids and long-term stability.
Pressure sensors optimized for hydrogen can therefore use special diaphragm and barrier designs.
13.3 Pressure Cycling and Material Fatigue
Repeated pressurization and depressurization can cause cyclic mechanical loading.
Design considerations must include the number of pressure cycles, pressure amplitude, temperature changes and the possible influence of hydrogen on material properties.
High static pressure resistance alone is not sufficient proof of suitability under cyclic loading.
13.4 Sealing Materials
Non-metallic seals must also be suitable for hydrogen, pressure and temperature.
Depending on the material and loading, permeation, swelling, mechanical damage or rapid gas decompression may be relevant.
Particularly with large pressure changes, the characteristics of the seal and its approval for the intended application must be considered.
14. Pressure Connections, Measuring Lines and Seals
The hydraulic or pneumatic connection of a pressure sensor influences not only leak tightness but also its dynamic measurement characteristics.
14.1 Suitable Process Connections
For high-pressure hydrogen, the process connection, sealing principle and material must be matched to one another.
A thread alone does not constitute a complete pressure-tight connection.
The intended sealing surface, sealing element and mechanical connection must be compatible with the specific connection geometry.
14.2 Long Measuring Lines
Long or very narrow measuring lines can dynamically influence pressure signals.
Depending on gas volume, line length and flow conditions, delays, damping or resonance effects are possible.
The actual transfer function of the measuring arrangement should therefore be considered when measuring fast pressure transients.
14.3 Dead Volumes
Additional internal volumes in adapters, valves or measuring chambers can affect dynamic characteristics.
The compressibility of gaseous hydrogen plays an important role in this context.
14.4 Test Connections Suitable for Hydrogen
Special test and service connections are available for verification measurements and maintenance tasks.
When selecting these components, the manufacturer’s specifications and reduced pressure limits applicable to gaseous hydrogen must be considered.
Approval of a connection for other gases or hydraulic media must not automatically be extended to a high-pressure hydrogen application.
Connecting and disconnecting equipment and using measuring or depressurization connections must be carried out exclusively in accordance with the approved system and safety procedures.
15. Sensor Bandwidth, Sampling Rate and Signal Filtering
During rapid pressure changes, the static accuracy of a pressure transmitter is not the only decisive factor.
Its time-dependent transfer function also determines which pressure profiles can actually be recorded.
15.1 Dynamic Characteristics of the Pressure Sensor
A sensor with high bandwidth can generally follow rapid pressure changes better than a heavily damped measurement system.
However, the usable dynamic response depends on the specific configuration, output signal and complete measurement chain.
The bandwidth of the sensing element must not automatically be equated with the bandwidth of the connected measurement system.
15.2 Sampling Rate of the Data Acquisition System
The sampling rate must be suitable for the highest relevant signal frequency.
According to the Nyquist principle, the sampling frequency for an ideally band-limited signal must be greater than twice the highest frequency present to allow unambiguous reconstruction in principle.
For practical transient recording, the required time resolution, filter characteristics and a sufficient margin above the theoretical minimum sampling rate must also be considered.
15.3 Analog Current Outputs
A pressure transmitter with a 4-to-20-mA output may be suitable for continuous pressure monitoring.
However, for very rapid pressure events, it must be checked how quickly the output electronics respond and how the control system records the signal.
A PLC input designed for slowly changing process values may not provide sufficient time resolution for highly dynamic events.
15.4 Signal Filters and Averaging
Filters and moving averages can stabilize a measurement signal.
At the same time, they can reduce or delay short pressure peaks.
When evaluating rapid H₂ depressurization, the configured filters and their effects must therefore be known.
15.5 Pressure Oscillations
Local pressure fluctuations can occur during unsteady flow conditions.
These must not be interpreted as temperature changes, leakage or faulty pressure control without further verification.
If necessary, a separate dynamic investigation of the pressure measurement path must be performed.
16. Correct Time-Based Evaluation of Pressure and Temperature Data
Joint evaluation of pressure and temperature requires suitable time synchronization.
If pressure and temperature signals are recorded at different sampling rates or with different time delays, apparent physical relationships may arise that are actually caused by the measurement equipment.
16.1 Common Time Base
All measurement channels relevant to the evaluation should be assigned to a traceable common time base.
When several data acquisition systems are used, their time synchronization must be considered.
16.2 Temperature Sensor Delay
The response time of a temperature sensor can be considerably longer than the response time of the pressure sensor.
As a result, the temperature profile may appear significantly delayed relative to the pressure profile.
This delay must be considered during interpretation.
16.3 Rate of Pressure Change
An important parameter for dynamic behavior is the rate of pressure change over time:
dp / dt
It describes how much the pressure changes within a given time interval.
For discrete measured values, the following approximation can be used:
dp / dt ≈ (pi+1 – pi) / (ti+1 – ti)
For noisy signals, the derivative must be determined using a suitable, documented method.
16.4 Rate of Temperature Change
Similarly, the rate of temperature change over time can be considered:
dT / dt
Joint analysis of dp/dt and dT/dt makes it possible to identify different phases of depressurization and temperature equalization.
16.5 Plausibility Check
The following questions are particularly useful during evaluation:
- Does the temperature decrease begin at a time that is physically plausible relative to the pressure decrease?
- Is the measured temperature change consistent with the response time of the sensor?
- Does temperature equalization occur after depressurization has ended?
- Does the pressure change following the temperature increase?
- Are there indications of measuring range exceedance or signal filtering?
- Are the same events recorded consistently over time at different measuring points?
A reliable interpretation should consider the complete time-dependent profile rather than only individual minimum or maximum values.
17. Measurement Uncertainty and Thermal Measurement Errors
During dynamic high-pressure measurements, several uncertainty contributions may occur simultaneously.
In addition to static sensor error, temperature dependence, dynamic signal transmission and actual operating conditions must be considered in particular.
17.1 Static Measurement Error
The static accuracy of a pressure transmitter is often specified as a percentage of full scale.
However, this specification does not necessarily describe all errors over the entire temperature range.
17.2 Temperature Compensation
Pressure transmitters may be temperature-compensated for a defined temperature range.
If the actual sensor temperature falls outside this range, additional measurement errors may occur.
Even within the compensated temperature range, the specified total measurement error must be considered.
17.3 Rapid Thermal Changes
Rapid temperature changes can temporarily create temperature differences within the sensor.
Static temperature compensation may not completely account for such transient effects.
For particularly demanding applications, it should therefore be checked whether the manufacturer provides information about behavior during thermal transients.
17.4 Influence of Measuring Lines
Dynamic pressure transmission through a measuring line can influence the time-related accuracy of the pressure measurement.
Calibration of the sensor under static conditions does not fully describe this additional dynamic characteristic.
17.5 Temperature Measurement Uncertainty
Temperature measurement can be influenced by sensor error, installation conditions, heat conduction, flow and response time.
The uncertainty of the actual gas temperature must therefore not be equated solely with the accuracy class of the Pt100 or thermocouple used.
17.6 Documentation
For meaningful measurement evaluation, the sensors used, calibration data, measuring ranges, time base, filter settings and operating conditions should be documented.
Only then can repeated depressurization tests be compared meaningfully.
18. Distinguishing Leakage, Pressure Changes and Temperature Equalization
Leak tightness of the complete system is particularly important for high-pressure hydrogen.
However, a pressure drop is not automatically clear evidence of hydrogen loss.
In a closed storage vessel, cooling can also cause the pressure to decrease.
Conversely, heating can partially mask an existing hydrogen loss.
18.1 Pressure Change Without Mass Change
In an idealized closed, rigid vessel with constant gas mass, the following applies for an ideal gas:
p / T = constant
If the gas temperature decreases, the pressure can decrease even though no mass has left the storage vessel.
18.2 Pressure Change Caused by Hydrogen Loss
In the event of an actual leak, the gas mass present changes.
A pressure change may then be influenced both by mass loss and by simultaneous temperature changes.
Temperature must therefore be considered when evaluating suitable pressure-holding or leak-tightness tests.
18.3 Hydrogen Permeation
Hydrogen permeation can occur through certain materials.
This effect must be distinguished from leakage at a mechanical sealing point.
The materials, test conditions and permissible leak rate requirements are decisive for a suitable evaluation.
18.4 Reliable Leak-Tightness Verification
Proof of adequate leak tightness must be obtained using a procedure specified and approved for the system.
A pressure drop that can be explained mathematically does not replace a leak-tightness test required for safety purposes.
Likewise, stable pressure alone must not be considered complete proof of hydrogen leak tightness.
19. Explosion Protection and Safety-Related Limitations
Hydrogen is highly flammable and can form explosive mixtures with air.
During depressurization of a high-pressure hydrogen system, safe gas routing, suitable materials, explosion protection and monitoring of the system condition must therefore be considered in addition to the actual pressure reduction.
19.1 Depressurization Only Through Designated Equipment
A high-pressure hydrogen system must have a depressurization and safety concept specifically designed for this purpose.
Pressure reduction must not be improvised using unsuitable measuring connections, hose assemblies or valves that have not been approved for the application.
Safe hydrogen discharge must be part of the system design.
19.2 Vent Lines
Vent lines must be designed for the expected pressure, temperature and flow conditions.
Potential hazards from escaping hydrogen and the formation of flammable gas mixtures must also be considered.
The safe discharge location, protection against unintended air ingress and prevention of impermissible gas accumulation are important parts of a suitable concept.
19.3 Explosion Protection of Measuring Equipment
If a measuring point is located in a hazardous area, the specific electrical device version must meet the applicable explosion protection requirements.
The general availability of an ATEX version does not mean that every version of a sensor is suitable for every hazardous zone.
The specific marking, electrical connection conditions and installation requirements must be checked.
19.4 Functional Safety
A pressure transmitter can provide process information for higher-level monitoring or a protective function.
However, whether it may form part of a safety-related function must be assessed for the complete safety chain.
Selecting a hydrogen-compatible sensor alone does not replace a functional safety assessment.
19.5 Important Standards and Regulations
Depending on the application, the following standards and regulations may be relevant during project engineering:
- ISO/TS 15916 for fundamental safety considerations relating to hydrogen systems.
- ISO 19880-1 for gaseous hydrogen refueling stations within its applicable scope.
- ISO 11114-4 for defined material tests on steels used in seamless gas cylinders within the specified scope.
- Pressure Equipment Directive 2014/68/EU for pressure equipment and assemblies covered by the directive.
- The applicable explosion protection regulations and requirements for electrical equipment.
The actual applicability must be verified for each project. Individual standards have clearly defined scopes and cannot be used as blanket approval for an entire hydrogen system.
20. Systematic Testing and Commissioning Procedure
Commissioning a hydrogen pressure measurement system should follow a documented test plan.
The following steps relate to measurement preparation and evaluation. Approval for actual high-pressure hydrogen depressurization must be obtained separately in accordance with the verified safety procedure for the system.
- Define the measurement task: Specify the pressure and temperature profiles to be recorded and the required time resolution.
- Check measuring points: Clearly define the locations for storage vessel pressure, pipeline temperature and, where applicable, vessel wall temperature measurement.
- Document process conditions: Consider maximum pressure, normal operating temperature, possible temperature transients and pressure cycling.
- Verify hydrogen compatibility: Evaluate wetted materials, sensor diaphragms, seals and connections against manufacturer approvals.
- Check pressure resistance: Verify sensors, adapters, lines and connecting elements against the intended operating conditions.
- Check electrical configuration: Verify power supply, protective measures, grounding and any hazardous-area requirements.
- Identify sensors: Document model, serial number, measuring range, output signal and calibration status.
- Verify pressure reference: Clearly identify absolute, gauge or sealed-gauge versions.
- Check temperature measurement: Evaluate sensor type, installation conditions, thermowell and expected response time.
- Test signal transmission: Verify analog and digital inputs and correct scaling of the measurement system.
- Check the time base: Ensure synchronization of pressure and temperature channels.
- Document filter settings: Check the suitability of sensor and data acquisition filters for the measurement task.
- Verify leak tightness: Apply the test procedure specified and approved for the system.
- Check approval status: Verify that all safety-related prerequisites for the intended operating procedure have been fulfilled.
- Record measurement data: Monitor the approved operating or depressurization procedure with complete time-dependent recording.
- Check measurement plausibility: Evaluate pressure and temperature changes together with any dynamic abnormalities.
- Consider temperature equalization: Do not equate the subsequent thermal condition with the condition immediately after pressure reduction.
- Prepare a test report: Document measurement data, boundary conditions, sensor information, abnormalities and evaluation in a traceable manner.
If discrepancies occur, measurement interpretation must not be used as a substitute for required safety-related tests or approvals.
21. Typical Fault Symptoms and Targeted Troubleshooting
Different signal profiles can occur during depressurization. Not every unusual curve immediately indicates a defective sensor.
The decisive factor is distinguishing between actual thermodynamic processes, dynamic characteristics of the measurement chain and possible technical faults.
| Observation | Possible Cause | Suitable Diagnostic Action |
|---|---|---|
| Pressure decreases and the temperature inside the storage vessel also decreases | Cooling of the remaining gas mass during depressurization | Check the time-dependent relationship and compare it with a suitable thermodynamic model |
| Pressure rises again after depressurization has ended | Warming of the previously cooled gas while the gas inventory is enclosed | Consider the temperature profile and the condition of the shut-off valves |
| Temperature signal responds significantly later than the pressure signal | Thermal inertia of the temperature sensor or thermowell | Check the response time and installation conditions of the temperature measurement system |
| Temperature measuring points indicate different values | Spatial temperature gradients or different heat transfer conditions | Compare positions, measuring principles and thermal contact at the measuring points |
| Pressure signal shows short peaks | Actual pressure transients, line resonance or electrical influences | Investigate the measurement path, bandwidth, sampling rate and filtering |
| Pressure display and PLC value do not match | Scaling error, output filter or signal acquisition problem | Check output signal and input scaling separately |
| Pressure sensor shows an offset during temperature changes | Thermal zero-point influence or transient compensation deviation | Check temperature conditions and manufacturer specifications |
| Pressure decreases slowly during a leak-tightness test | Possible leakage, temperature change or another gas loss mechanism | Consider temperature compensation and the specified leak-tightness test procedure |
| Measured value profile is delayed by a long measuring line | Gas compressibility and dynamic behavior of the connection volume | Evaluate measuring line geometry and dynamic transfer function |
| Sensor readings change after many pressure cycles | Long-term drift, mechanical loading or possible hydrogen-related influences | Check reference measurements, calibration history and the condition of the measuring point |
The listed causes are possible diagnostic explanations and do not constitute definitive proof of a fault.
In the event of safety-related abnormalities, the protective and testing procedures specified for the system are authoritative.
22. Suitable ICS Products for High-Pressure Hydrogen
ICS Schneider Messtechnik offers various suitable product families for measuring pressure and temperature in hydrogen systems.
Selection depends on the pressure range, temperature, required measurement dynamics, hydrogen compatibility and installation conditions.
Particularly during rapid depressurization, the static accuracy of a measuring instrument must be distinguished from its dynamic signal transmission capability.
22.1 Druck UNIK 5000H – Analog Pressure Sensor for Hydrogen
The Druck UNIK 5000H is a pressure sensor specifically optimized for hydrogen applications.
It is based on UNIK 5000 technology and uses hydrogen-compatible wetted materials.
Documented features include:
- Measuring ranges from 700 mbar to 700 bar, depending on pressure reference and configuration.
- Accuracy of up to ±0.04 % FS according to the BSL method.
- Frequency response up to 3.5 kHz.
- Analog output signals such as mV, current and voltage.
- Various pressure and electrical connection options.
- Versions with suitable explosion protection approvals.
- Documented temperature range from -55 to +125 °C in suitable configurations.
Due to its potentially high frequency response, the UNIK 5000H is particularly interesting when rapid pressure changes need to be recorded.
However, during selection, it must be checked whether the specifically configured output and electronics version provides the required dynamic signal transmission.
The pressure reference, temperature range and actual connection conditions must also match the measuring point.
The UNIK 5000H can be used, for example, in hydrogen storage systems, test benches, fuel cell systems and suitable H₂ infrastructure applications.
Further Information: Druck UNIK 5000H at ICS Schneider Messtechnik
22.2 Druck RPS/DPS8000H – High-Precision Hydrogen Pressure Measurement
The Druck RPS/DPS8000H is a high-precision pressure sensor family for hydrogen applications.
It combines TERPS resonant sensor technology with a hydrogen-compatible barrier design.
Documented features include:
- Accuracy of up to ±0.01 % FS over the respective compensated temperature range.
- High long-term stability with a specified order of magnitude of ±100 ppm FS per year.
- Media-isolated design.
- Hydrogen-compatible configuration.
- Various digital or frequency-based output options.
- Configuration-dependent temperature ranges down to -55 °C and up to +125 °C.
The sensor is particularly interesting for applications requiring high accuracy and long-term stability.
This may be relevant, for example, for precise monitoring of storage pressures or demanding test bench measurements.
However, high static accuracy does not automatically demonstrate suitability for detecting arbitrarily fast pressure peaks.
For highly dynamic pressure measurement, the characteristics of the selected output, update rate and complete signal transmission system must therefore be checked.
Further Information: Druck RPS/DPS8000H at ICS Schneider Messtechnik
22.3 HT-H2 Series – Hydrogen-Compatible High-Pressure Sensor
The HT-H2 Series includes pressure sensors for hydrogen applications such as storage, refueling, production and fuel cell technology.
The series documented by ICS offers the following features, among others:
- Pressure measuring ranges up to 0 to 1000 bar, depending on the configuration.
- 2-wire current output of 4 to 20 mA.
- Various 3-wire voltage outputs.
- Accuracy specifications of up to or less than or equal to 0.2 %, depending on the specification.
- Various mechanical process connections.
- Optional approvals depending on the configuration.
The sensor is therefore a potential solution for continuous pressure monitoring in high-pressure hydrogen systems.
For applications involving rapidly changing pressure, the dynamic characteristics of the specific configuration must also be checked.
The specified pressure ranges and approval options must not be transferred to every possible sensor variant without verification.
Further Information: HT-H2 Series at ICS Schneider Messtechnik
22.4 WIKA TR10-B – Resistance Thermometer for Suitable H₂ Temperature Measuring Points
The WIKA TR10-B is an industrial resistance thermometer designed for installation in a thermowell.
It is generally suitable for many industrial temperature measurement tasks and is also listed in the H₂ temperature sensor category at ICS.
Documented features include:
- Sensor ranges from -196 to +600 °C.
- Pt100 or Pt1000 resistance elements.
- Installation in various thermowell designs.
- Replaceable, spring-loaded measuring inserts.
- Different connection heads and configuration options.
- Availability of explosion-protected versions.
For temperature monitoring of a hydrogen storage vessel, the TR10-B may be a suitable solution in combination with an appropriate thermowell.
Pressure and hydrogen compatibility cannot be determined from the TR10-B sensor type alone.
The thermowell, process connection, seal, material and dynamic response time must be designed together for the specific measuring point.
Particularly during rapid temperature changes, the delay caused by the complete thermowell assembly should be considered.
Further Information: WIKA TR10-B at ICS Schneider Messtechnik
22.5 MINIMESS Xtreme Pressure – Test Connections for High-Pressure Applications
The MINIMESS Xtreme Pressure product family includes high-pressure test and service connections for suitable measurement and maintenance tasks.
The product documentation describes operating pressure ranges up to 1000 bar for corresponding applications.
For gaseous hydrogen, however, use is only intended under separately specified conditions and with a reduced permissible pressure range.
This means that the general high-pressure rating must not automatically be interpreted as approval for hydrogen up to the same pressure.
For hydrogen applications, the respective connection variants, wetted materials, seals and permissible pressure range must be checked against the specific manufacturer documentation.
MINIMESS test connections can form part of a suitable measurement and testing system. However, they do not replace specially designed and safety-approved depressurization equipment.
Further Information: MINIMESS Xtreme Pressure at ICS Schneider Messtechnik
22.6 Selecting a Complete H₂ Measurement Chain
The suitability of a measurement solution depends on how all components work together.
For a technical inquiry, the following information in particular should be available:
- Gas state and hydrogen purity.
- Normal operating pressure and maximum possible pressure.
- Expected temperature ranges and transient temperature changes.
- Planned time-dependent profile or required dynamic response of the pressure measurement.
- Type of pressure reference.
- Required static accuracy and measurement uncertainty.
- Required electrical output signals.
- Mechanical installation conditions and connection geometry.
- Material and sealing requirements.
- Any required hazardous-area and other approvals.
- Required data recording and time synchronization.
- Requirements for testing, calibration and documentation.
Based on this information, a suitable combination of pressure sensor, temperature measuring point and data acquisition system can be selected.
Hydrogen Applications Product Category at ICS Schneider Messtechnik
23. Conclusion: Evaluate Pressure and Temperature Together
Depressurization of high-pressure hydrogen is a demanding process from both a thermodynamic and a measurement perspective.
It is particularly important to distinguish between slow depressurization with greater thermal equalization and fast depressurization, during which the remaining gas can cool significantly.
The Joule-Thomson effect must not be confused with the temperature change of the gas inside the storage vessel.
Hydrogen can warm up during approximately isenthalpic throttling at typical ambient temperatures while the gas remaining inside the storage vessel cools down at the same time.
These different processes demonstrate why pressure and temperature measurements at different locations within a system do not automatically describe the same physical conditions.
The time-dependent behavior must also be considered. A pressure transmitter can detect rapid pressure changes, while a temperature sensor may respond with a delay due to its thermal inertia.
At high rates of pressure change, measuring lines, signal filters, sampling rates and dynamic sensor characteristics can also influence the recorded signals.
A reliable evaluation therefore requires pressure and temperature to be recorded as synchronously as possible, while taking the characteristics of the complete measurement chain into account.
In addition, hydrogen imposes special requirements on materials, seals, sensing diaphragms and high-pressure connections.
High static measurement accuracy or high pressure resistance alone is not sufficient to confirm the suitability of a sensor for dynamic high-pressure hydrogen applications.
The measuring instruments used must be suitable for the respective pressure, temperatures, hydrogen exposure and required dynamic response.
For measurement analysis, a comprehensive approach is therefore recommended in which the process state, pressure profile, gas temperature, vessel temperature, sensor behavior and data recording are evaluated together.
The key conclusion is: The pressure profile shows how pressure changes. Only additional temperature measurement and a suitable thermodynamic model enable a well-founded evaluation of the actual gas state during and after H₂ depressurization.
24. Frequently Asked Questions About H₂ Depressurization
24.1 Does Hydrogen Cool Down During Rapid Depressurization?
During rapid discharge of a pressure vessel, the hydrogen remaining inside the vessel can cool down. This occurs because the escaping gas carries energy out of the vessel, while heat transfer from the surroundings is often limited during a fast process. The actual temperature change depends on the operating conditions, vessel and gas state.
24.2 Why Can Hydrogen Become Warmer During Throttling?
Hydrogen has a negative Joule-Thomson coefficient at typical ambient temperatures. Approximately isenthalpic throttling can therefore cause a temperature increase. This effect relates to the throttling process and must be distinguished from cooling of the gas remaining inside the storage vessel.
24.3 What Is the Difference Between Slow and Fast H₂ Depressurization?
During slow depressurization, more heat can be exchanged between hydrogen, the vessel wall and the surroundings while the pressure is being reduced. During fast depressurization, this heat exchange is often smaller relative to the duration of the process. Faster and more pronounced temperature transients may therefore occur. However, the terms slow and fast must always be evaluated relative to the specific system.
24.4 Why Does the Temperature Inside a High-Pressure Hydrogen Storage Vessel Decrease?
During discharge, hydrogen leaves the storage vessel and carries energy with it. If the heat input from the surroundings is insufficient to compensate for this effect, the temperature of the remaining gas mass decreases. The magnitude of cooling depends, among other factors, on the pressure profile, heat transfer and real gas behavior.
24.5 Why Does Pressure Rise Again After Depressurization Has Ended?
After rapid depressurization, the initially cooled hydrogen can be warmed again by the vessel wall and the surroundings. If the storage vessel is closed and the gas mass remains constant, the pressure can also increase. Such temperature equalization must be considered when interpreting the pressure profile.
24.6 Can Hydrogen Temperature Be Determined from Pressure Alone?
Not in general. Pressure depends on gas mass, temperature, volume and real gas behavior, among other factors. During depressurization, the gas mass changes. Without additional information, the temperature therefore cannot be determined unambiguously from the measured pressure alone.
24.7 Which Formula Describes the Temperature Change During Rapid Depressurization?
For a highly simplified, perfectly mixed and adiabatic vessel discharge model using an ideal gas, the relationship T₂/T₁ = (p₂/p₁)(κ-1)/κ can be used. The formula explicitly does not describe every possible throttling or depressurization process. More advanced models are required for real high-pressure hydrogen systems.
24.8 Why Must Absolute Pressure Be Used in Calculations?
Thermodynamic gas equations use absolute pressure. Gauge pressure values, by contrast, are referenced to ambient pressure. If pressure ratios are incorrectly calculated using gauge pressure, significant errors can occur, particularly at lower pressures. The pressure references must therefore be clearly identified for calculations.
24.9 Which Pressure Sensor Is Suitable for Rapid H₂ Pressure Changes?
A suitable sensor is a hydrogen-compatible pressure sensor with an appropriate pressure and temperature range and sufficient dynamic signal transmission capability. For example, the Druck UNIK 5000H available from ICS offers a specified frequency response of up to 3.5 kHz. However, the characteristics of the selected version and the entire measurement chain must be checked for the specific application.
24.10 Is a Pressure Transmitter with a 4-to-20-mA Output Suitable for Rapid Depressurization?
In principle, a 4-to-20-mA output can also transmit time-varying pressure signals. However, the decisive factor is how quickly the sensor, output electronics and connected acquisition system respond. High static accuracy alone provides no information about the complete dynamic measurement capability.
24.11 Why Does My Temperature Sensor Indicate Less Cooling Than Expected?
One possible cause is the thermal inertia of the measuring arrangement. Thermowells, larger sensor masses or unfavorable heat transfer can cause rapid gas temperature changes to be displayed only after a delay or with reduced amplitude. Spatial temperature differences and an unrepresentative measuring position can also play a role.
24.12 Can an Externally Mounted Temperature Sensor Measure the Gas Temperature?
An externally mounted sensor directly measures the temperature of the surface to which it is attached. During rapid depressurization, this temperature can differ significantly from the actual gas temperature. Direct measurement of the gas temperature requires an appropriately designed process measuring point suitable for hydrogen.
24.13 Which Materials Are Suitable for High-Pressure Hydrogen?
Material selection depends on pressure, temperature, hydrogen exposure and mechanical loading. Suitable austenitic stainless steels and special alloys may be considered depending on the application. However, actual suitability must be demonstrated for the specific material version and complete design. General approval based solely on a material designation is insufficient.
24.14 Can Hydrogen Damage a Pressure Sensor?
Under certain conditions, hydrogen can diffuse through materials and affect the mechanical properties of suitable and unsuitable components differently. In pressure sensors, the diaphragm, seals and media-isolated design may be relevant, among other factors. Pressure sensors specifically suitable for hydrogen should therefore be used for corresponding applications.
24.15 Why Is Leak Tightness Particularly Important for H₂ Measuring Connections?
Hydrogen has a high diffusion capability and can escape through unsuitable connections. High-pressure applications therefore require suitable materials, connection geometries, seals and verified installation procedures. A tightly fastened threaded connection alone does not provide sufficient proof of a permanently hydrogen-tight connection.
24.16 Can MINIMESS Connections Be Used for High-Pressure Hydrogen?
According to manufacturer documentation, certain MINIMESS product variants are intended for gaseous hydrogen. However, special operating conditions and, in some cases, reduced permissible pressure ranges apply. The general pressure rating for hydraulic applications must not automatically be transferred to hydrogen. The specific manufacturer approvals for the actual configuration are decisive.
24.17 How Can Leakage Be Distinguished from a Temperature-Related Pressure Drop?
A suitable evaluation considers pressure, temperature, vessel volume and, where necessary, real gas behavior. A pressure change can also occur without mass loss as a result of a temperature change. Nevertheless, an approved test procedure is required for actual leak-tightness verification. Calculated temperature compensation does not replace a prescribed leak test.
24.18 Which Measurement Data Should Be Recorded During H₂ Depressurization?
For meaningful analysis, at least the time-dependent pressure profile, suitable gas temperature measurements and relevant operating states should be documented. Depending on the application, additional temperatures, device status messages and further process data may be required. An appropriate sampling rate, common time base, documented filter settings and clear assignment of measuring points are important. Only then can depressurization be evaluated in a traceable manner from both a thermodynamic and measurement perspective.