


A PV string has an open-circuit voltage of approximately 850 V according to the data sheet. During testing, 842 V is measured. At first glance, this value appears completely plausible. Nevertheless, the inverter shows that this particular string consistently generates significantly less power than several identical neighboring strings in the same system.
A simple voltage measurement provides only limited help when troubleshooting this type of problem. The open-circuit voltage describes only a single operating point at which practically no current is flowing. The short-circuit current alone also provides only one additional point of the electrical characteristic. Many faults in a PV module or string only become visible when the behavior between these two endpoints is examined.
This is exactly why the complete I-U curve, or I-V curve, is measured. It shows the relationship between current and voltage over the entire operating range from short circuit to open circuit. This makes it possible not only to determine the open-circuit voltage and short-circuit current, but also to evaluate how the generator behaves around the Maximum Power Point and whether the shape of the curve matches the expected behavior.
Partial shading, uneven soiling, mismatch between cell groups or modules, active bypass paths and increased series resistance can cause characteristic changes in the curve. A string can therefore have an almost normal open-circuit voltage and still deliver significantly less usable power. Faults that only become effective under load often remain hidden in a simple Voc measurement.
However, the shape of the curve must never be evaluated in isolation. The generated current depends strongly on the current irradiance, while module temperature primarily influences voltage. Even a completely intact module can therefore deviate significantly from its nameplate values under Standard Test Conditions when it is hot or when solar irradiance is lower.
A reliable I-V curve measurement therefore always combines the electrical measurement with the actual environmental conditions. Irradiance, module temperature, stored module data and string configuration must be recorded or configured correctly at the time of measurement. Only then can it be determined whether a deviation is actually caused by the PV generator.
A reliable PV I-V curve measurement therefore consists of two parts: First, the electrical curve and the actual measurement conditions must be recorded correctly. The measured curve is then evaluated to determine whether its shape, characteristic values and power output under these conditions match the expected behavior of the module or string.
What Does the I-V Curve of a PV Module Show?
A photovoltaic module does not operate at one fixed voltage and one fixed current. Its electrical operating point is determined both by the connected load and by irradiance, cell temperature and the actual condition of the module. Shading, soiling, ageing and electrical defects can therefore affect not only a single measured value but the entire current-voltage characteristic.
The I-V curve describes the relationship between current I and voltage U over the complete operating range. At one end of the curve, at approximately U = 0 V, lies the short-circuit current ISC. At the other end, at I = 0 A, lies the open-circuit voltage VOC.
Between these two points lies the region that is decisive for energy generation. Electrical power is calculated as P = U × I. The point at which this product reaches its maximum is known as the Maximum Power Point, or MPP. It is described by VMPP and IMPP.
The position and shape of this characteristic knee contain important diagnostic information. A generator can still produce plausible values at both endpoints while already having lost considerable power in the region of its actual operating point.
Understanding Voc, Isc, MPP and Fill Factor Correctly
A complete I-V curve measurement determines several characteristic values, each of which describes a different aspect of the electrical behavior. Only by considering them together can the condition of the PV generator be evaluated meaningfully.
| Characteristic Value | Meaning | Practical Information |
|---|---|---|
| VOC | open-circuit voltage | voltage with practically no load current |
| ISC | short-circuit current | current at nearly 0 V |
| VMPP | MPP voltage | voltage at the maximum-power operating point |
| IMPP | MPP current | current at the maximum-power operating point |
| PMPP | maximum power | product of VMPP and IMPP |
| FF | fill factor | measure of the shape or rectangularity of the curve |
The fill factor can be simplified as FF = PMPP / (VOC × ISC). It relates the actual maximum achievable power to the theoretical rectangle formed by the open-circuit voltage and short-circuit current.
This explains why a module can simultaneously have an almost normal open-circuit voltage and a plausible short-circuit current while its maximum usable power is already reduced. The cause is then not necessarily found at the two endpoints, but in the shape of the curve between them.
Why Open-Circuit Voltage and Short-Circuit Current Alone Are Not Enough
A measurement of Voc and Isc examines only two operating points of the PV generator. Many relevant faults, however, have a much greater effect under load. A weak module or impaired cell group may still deliver almost the expected voltage under open-circuit conditions, while the fault becomes much more significant as soon as current flows.
A typical example is an active bypass path. Under certain operating conditions, a weak cell group is bypassed by a bypass diode. This allows the string to continue delivering current, but part of the voltage is lost. A characteristic step or notch often appears in the complete I-V curve.
An increased series or contact resistance is also barely visible under open-circuit conditions because practically no current is flowing. Under load, however, an additional voltage drop occurs. The curve becomes unfavorably distorted, particularly in the region between the MPP and open-circuit voltage, and the maximum available power decreases.
I-V curve measurement therefore examines not only whether current and voltage are basically present, but how the entire PV generator behaves under different electrical load conditions.
How Irradiance Changes the I-V Curve
The current generated by a PV module depends strongly on the solar irradiance reaching the cells. As irradiance decreases, the short-circuit current in particular is reduced, and therefore the available operating current also decreases. The open-circuit voltage also changes, but much less strongly.
A curve measured at 950 W/m² therefore cannot be compared directly with a curve recorded at only 600 W/m². Even two completely identical and technically fault-free modules would generate different current and power values under these conditions.
Irradiance should therefore be recorded as close in time as possible to the I-V curve measurement. Especially under changing cloud conditions, irradiance can vary so significantly within a few seconds that a delayed irradiance measurement can already lead to an incorrect assessment.
How Module Temperature Affects the I-V Curve
In addition to irradiance, cell or module temperature primarily affects the voltage side of the I-V curve. With typical crystalline silicon modules, increasing temperature causes the open-circuit voltage and MPP voltage in particular to decrease. As a result, the maximum available power normally also decreases.
Current is affected much less by temperature and may even increase slightly in crystalline silicon cells. These two effects therefore influence the I-V curve differently.
A module operating on a sunny roof at a temperature well above 25 °C can deliver a visibly lower open-circuit voltage than the STC value stated in the data sheet without there being any defect at all. An assessment based solely on the nameplate voltage would therefore be misleading.
Why Measurements Are Converted to Standard Test Conditions
Manufacturer data for PV modules is specified under defined reference conditions. Standard Test Conditions, or STC, include in particular an irradiance of 1,000 W/m² and a cell temperature of 25 °C.
In real PV systems, these conditions are rarely present exactly. If a module is measured at 43 °C, for example, its voltage values will naturally be lower than at 25 °C. Similarly, irradiance below 1,000 W/m² primarily changes the current side of the curve.
Professional I-V curve testers therefore record irradiance and module temperature in addition to the electrical curve and can convert the measured values to reference conditions using the appropriate procedures. IEC 60891 is relevant, among other standards, for such conversion methods.
Without taking the actual temperature and irradiance conditions into account, a completely intact PV module can incorrectly be classified as underperforming.
Detecting Shading in the I-V Curve
Partial shading is one of the causes that can change an I-V curve particularly characteristically. If only part of a module receives less irradiance, the affected cells generate less current than the remaining cells.
Because cells and cell groups within the module are electrically coupled, a current mismatch occurs. The less illuminated group can no longer carry the current generated by the better illuminated sections without restrictions. Depending on the intensity and position of the shading, a bypass diode may then become conductive.
This frequently creates steps, notches or abrupt changes in slope in the I-V curve. In some cases, several local power maxima may even appear. The exact shape depends on which cell groups are affected, how strongly the irradiance has been reduced and how the bypass diodes are connected within the module.
A relatively small shadow edge can therefore reduce power much more than its physical area might initially suggest. Railings, antennas, roof structures or shading from adjacent module rows can therefore produce characteristic I-V curve distortions.
What Bypass Diodes Have to Do with Steps in the Curve
Bypass diodes protect cell groups from excessive reverse bias when a strong current mismatch occurs. If, for example, one cell group is heavily shaded, the corresponding bypass diode can become conductive and route current around that section of the module.
This allows the overall string current to continue flowing, but the bypassed cell group no longer contributes to the total voltage in the same way. Electrically, part of the module voltage is therefore lost.
This transition often appears as a step or notch in the I-V curve. However, such a shape does not automatically prove that the bypass diode itself is defective. The diode may be operating correctly in response to another fault.
| I-V Curve Abnormality | Possible Cause | Recommended Further Check |
|---|---|---|
| Step or notch | partial shading or local soiling | visual inspection and repeat measurement without shading |
| Step remains permanently | cell damage or electrical fault in a cell group | individual module test and thermography |
| Missing voltage section | permanently bypassed cell group or bypass path | investigate module and junction box further |
| Unusual thermal behavior at the junction box | bypass diode or connection problem | thermography and electrical testing |
A step in the I-V curve should therefore initially be regarded as an indication of mismatch or an active bypass process. The actual cause must then be identified using further tests.
Detecting Mismatch Between Modules and Cell Groups
In a conventional PV string, several modules are connected electrically in series. The same string current therefore flows through every module. If one module or cell group has a significantly lower current capability, this deviation can affect the behavior of the entire string.
Mismatch can be caused by differences in module condition, ageing, local soiling, temperature differences, shading, cell damage or even a module type that does not match the rest of the string.
A comparison of several identical strings in the same system is therefore particularly informative. If strings 1 to 5 and strings 7 to 8 have similar I-V curves under comparable conditions while only string 6 deviates significantly, troubleshooting can be focused specifically on that generator branch.
For parallel-connected strings, the individual string currents can also be compared. Again, irradiance, orientation and temperature should be as similar as possible.
Distinguishing Uniform and Local Soiling
Soiling can influence the I-V curve very differently depending on how it is distributed. A largely uniform layer of dirt mainly reduces the irradiance reaching the cells. The resulting curve can resemble a generally lower irradiance level: current and therefore power decrease without necessarily producing pronounced steps.
Local soiling behaves more like partial shading. Bird droppings, leaves, residual snow or strongly localized deposits can affect individual cells or cell groups much more strongly than the rest of the module. This creates internal mismatch and may activate a bypass path.
A repeat measurement after cleaning is therefore a relatively simple and very informative test. If the curve distortion disappears afterwards, local soiling was the main cause. If the abnormality remains, the search should continue for an electrical or cell-related fault.
Detecting Increased Series Resistance
Every PV module and every string has unavoidable electrical series resistance. Cell interconnects, busbars, module connections, cables, connectors, terminals and other contact points all contribute to it.
If this resistance increases because of corrosion, poorly assembled connectors, damaged cell interconnects or other ageing or contact problems, additional voltage losses occur under load. The higher the current, the greater the effect of the fault.
In the I-V curve, increased series resistance typically appears as an unfavorable rounding or distortion of the region from the MPP toward the open-circuit voltage. The fill factor and maximum available power decrease.
A simple Voc measurement can remain almost completely normal at the same time. Under open-circuit conditions, practically no current flows, so almost no additional voltage drop occurs across the series resistance.
Evaluating Abnormalities Near the Short-Circuit Region
The shape of the I-V curve close to the short-circuit current also contains information about the electrical condition of the module. An unusually steep slope in this region may indicate additional internal current paths or a reduced parallel or shunt resistance.
Possible causes include cell damage, moisture ingress, internal leakage paths or local electrical defects. However, such a change should not be diagnosed solely from the curve shape. Non-uniform irradiance and unsuitable measurement conditions can also affect this part of the curve.
The I-V curve therefore provides a diagnostic indication that should subsequently be confirmed using additional electrical or optical test methods.
Systematically Investigating Low Open-Circuit Voltage
If the measured open-circuit voltage is significantly lower than expected, the first step should be to verify whether the expected values actually correspond to the real string configuration. An incorrect number of modules or the wrong module type selected in the tester can already create an apparent deviation.
Module temperature must then be taken into account. A PV generator that is significantly warmer than under reference conditions naturally has a lower open-circuit voltage than at STC.
If the difference remains abnormal even after considering temperature, possible causes include a permanently active or shorted bypass path, an electrically bypassed module, incorrect wiring or a section that no longer contributes to the string voltage as intended.
Because the module voltages add together within a string, an approximately missing module or cell-group voltage can provide an important indication of the affected section.
Systematically Investigating Low Short-Circuit Current
A low short-circuit current is not automatically proof of a module defect. Because the generated current depends strongly on irradiance, the optical and measurement conditions must be checked first.
Lower irradiance, uniform soiling or partial shading can reduce the current. An incorrectly positioned irradiance sensor can also cause the system to assume a higher irradiance for the expected-value calculation than is actually reaching the module.
Rapidly changing cloud conditions are particularly problematic. If irradiance changes within a few seconds between recording the environmental data and measuring the I-V curve, the two data sets no longer describe exactly the same operating condition.
Only when irradiance, sensor positioning and module data are plausible should a remaining current deviation be interpreted as a possible indication of degradation or an actual module fault.
Comparing Expected and Measured I-V Curves Correctly
A measured I-V curve becomes particularly informative when it can be compared with an expected curve. For this purpose, the correct technical data for the actually installed module must be stored in the measurement system.
Depending on the tester, this may include open-circuit voltage, short-circuit current, MPP voltage, MPP current, rated power and temperature coefficients. In addition, the number of modules and, if applicable, the number of parallel strings must be configured correctly.
An input error can create a considerable apparent performance deviation even though the PV generator is technically fault-free. Both the measured values and the stored configuration data should therefore always be checked before beginning extensive troubleshooting.
Positioning Irradiance and Temperature Sensors Correctly
The quality of an I-V curve corrected to reference conditions depends directly on the environmental data that is recorded. The irradiance sensor should therefore experience optical conditions that are as similar as possible to those of the PV modules being tested.
The same orientation and tilt angle are particularly important. If, for example, an irradiance sensor is placed horizontally on the roof while the modules are installed at a 35° angle, the recorded value may differ significantly from the irradiance actually reaching the module plane.
Local shading of the sensor or a dirty sensor surface can also distort the evaluation. The irradiance sensor itself therefore becomes a potential source of error in the I-V curve assessment.
The temperature sensor should likewise be attached to the module in a thermally appropriate manner. Ambient air temperature is not the same as actual module temperature. Under strong irradiance, a module can become significantly warmer than the surrounding air.
Measure a Module or the Complete String?
String measurements and individual module measurements serve different purposes. A complete string I-V curve is very useful for commissioning, periodic inspection and rapid comparison between several generator branches. If only one of several identical strings deviates significantly, an important part of the troubleshooting process has already been completed.
Individual module testing is then used for more precise localization. It is particularly useful when thermography, the shape of the I-V curve or comparison between strings already points to a specific area.
An efficient diagnostic path therefore often follows compare strings → identify abnormal string → test affected modules specifically. This avoids having to measure every module in the entire installation individually without a specific reason.
Practical Example: One String Delivers Significantly Less Power
A PV system consists of eight identical strings, each containing 20 identical modules with the same orientation. The inverter operating data shows that string 6 continuously delivers less power than the other seven strings.
During the initial visual inspection, no missing, fully covered or obviously damaged modules are found. The measured open-circuit voltage of string 6 is also only slightly lower than that of the neighboring strings. No clear cause can therefore be derived from the Voc measurement alone.
The I-V curves of all strings are then recorded under irradiance conditions that are as comparable as possible. While the other strings show a largely smooth curve, string 6 has a pronounced step in the middle voltage range.
The modules in this string are then inspected more closely for shading and soiling. A locally heavily soiled module area is found. After cleaning, the I-V curve is measured again. The step is now smaller but is still present. This shows that the soiling contributed to the problem but was not the only cause.
Troubleshooting is then narrowed down to individual modules. One module continues to show a characteristic deviation in one cell group. Additional thermography reveals an unusual cell group or an abnormal area around the junction box on this module.
The further investigation can therefore be focused specifically on this module. Depending on the manufacturer’s requirements, additional electrical tests or replacement of the affected module can then follow.
This example illustrates the main advantage of I-V curve measurement: It does not necessarily identify the defective component immediately, but it clearly shows that the electrical behavior of the string differs from the expected condition and indicates the region of the curve in which the cause should be investigated further.
Combining I-V Curve Measurement with Thermography
I-V curve measurement describes the electrical behavior of the PV generator, while thermography reveals local temperature differences. The two methods therefore provide different but highly complementary information.
If an I-V curve shows, for example, a step, an unusual resistance effect or reduced power, a thermal image can then be used to look specifically for hotspots, abnormal cell groups, overheated connectors or unusual junction-box temperatures.
Conversely, a thermally abnormal module can subsequently be evaluated in more detail using an electrical I-V curve measurement. A hotspot alone does not fully describe how strongly the electrical performance of the module or string is affected.
An abnormal I-V curve together with a thermal abnormality at the same module therefore provides considerably more diagnostic information than either method alone.
Measuring PV Strings Safely
PV generators produce DC voltage whenever sufficient irradiance is present, even if the inverter is switched off. In modern installations, string voltages can reach 1,000 V DC or 1,500 V DC. These voltages remain present as long as the modules are sufficiently illuminated and electrically connected.
I-V curve measurement must therefore only be carried out by appropriately qualified personnel using a tester suitable for the maximum voltage, maximum current and intended installation category.
Measurement cables, connectors and adapters must also be rated for the DC voltages and currents involved. In addition, the isolation and connection procedures specified by both the system manufacturer and the measurement-instrument manufacturer must be followed.
Particular attention must be paid to the risk of DC arcing. PV connectors must not simply be disconnected under load. The sequence for connecting and disconnecting the I-V curve tester must also be followed exactly according to its operating instructions.
Systematic Test Procedure
- Check the circuit diagram, string configuration and technical data of the modules actually installed.
- Ensure that the I-V curve tester is suitable for the maximum string voltage and maximum current.
- Disconnect the string from the inverter or operating system according to the specified safe procedure.
- Enter the correct module type, number of modules and, if applicable, string configuration into the tester.
- Position the irradiance sensor as precisely as possible in the module plane and attach the temperature sensor correctly to the module.
- Document current shading, soiling and any other visible abnormalities.
- Record the I-V curve and evaluate Voc, Isc, Vmpp, Impp, Pmpp and, if applicable, the fill factor.
- Compare the measured curve with the expected curve or a curve corrected to reference conditions.
- Look for steps, notches, unusual slopes and changes in the MPP region.
- Compare the result with identical neighboring strings under conditions that are as similar as possible.
- If abnormalities are present, first rule out shading and soiling.
- Then narrow down the abnormal string step by step to individual modules.
- If necessary, add thermography, visual inspection and further electrical tests.
- Document the measurement conditions and I-V curves for future comparison and periodic testing.
Common Errors During I-V Curve Measurement
- Measuring only Voc: Faults around the MPP or under load can remain completely hidden.
- Measuring only Isc: Changes in curve shape and voltage under load are not detected.
- Not measuring irradiance: A normal reduction in current due to lower solar irradiance may be misinterpreted as a module defect.
- Using only ambient temperature: The actual cell or module temperature can be significantly higher.
- Using incorrect module or string data: The calculated expected curve then does not match the actual generator.
- Incorrectly positioning the irradiance sensor: The measured irradiance does not correspond to the optical conditions of the modules.
- Measuring under rapidly changing cloud conditions: Irradiance and electrical curve may represent different operating states.
- Interpreting every step as a defective bypass diode: Shading, local soiling or cell damage can also trigger a correctly functioning bypass path.
- Overlooking small shadows during measurement: Railings, antennas or even the person performing the test can affect individual cell groups.
- Looking only at Pmax: The shape of the I-V curve contains additional important diagnostic information.
- Comparing strings under significantly different conditions: Irradiance and temperature must be taken into account during evaluation.
- Disconnecting PV connectors under load: This can create a dangerous DC arc.
Suitable PV I-V Curve Testers
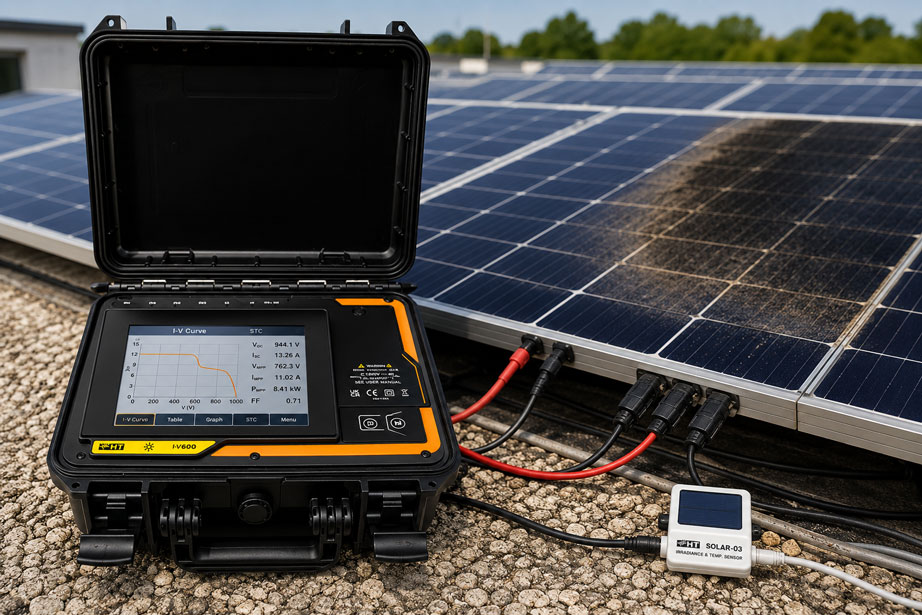
For professional I-V curve measurement on current PV modules and strings, the I-V600, for example, is suitable. The instrument is designed for I-V curve measurements on individual modules and complete strings and supports voltages up to 1,500 V DC and currents up to 40 A DC.
| Feature | I-V600 | I-V400w |
|---|---|---|
| Application | modules and strings in current PV systems | modules and strings with lower maximum voltages |
| Maximum DC voltage | up to 1,500 V DC | up to 1,000 V DC |
| I-V curve measurement | I-V curve including characteristic performance values | I-V curve including characteristic performance values |
| Environmental data | temperature and irradiance recording with SOLAR-03 | depending on system configuration |
| Evaluation | PV module database and graphical curve display | graphical I-V curve and relevant characteristic values |
The I-V600 determines, among other values, the open-circuit voltage VOC, short-circuit current ISC and the characteristic power values of the I-V curve. The graphical display directly on the instrument supports rapid assessment of the curve shape. With the SOLAR-03 data logger, irradiance and temperature can also be recorded.
For systems with lower maximum voltages, the I-V400w is also available. It enables I-V curve measurements on individual modules and strings up to 1,000 V DC and displays, among other values, current power, peak power, short-circuit current, open-circuit voltage and the graphical I-V curve.
Further instruments for commissioning, troubleshooting and testing photovoltaic systems can be found under Photovoltaic Instruments / PV Test Equipment at ICS Schneider.
Further electrical test and measuring instruments can be found under Electrical Test and Measuring Instruments.
Conclusion
A complete I-V curve measurement provides significantly more information about the actual condition of a PV module or string than measuring only the open-circuit voltage or short-circuit current. It examines the electrical behavior across the complete operating range and therefore makes faults visible that become relevant only under load.
Partial shading, local soiling and mismatch can create characteristic steps and notches when individual cell groups deliver less current and bypass paths become active. Increased series resistance, on the other hand, often changes the shape of the curve between the MPP and open-circuit voltage and reduces both the fill factor and the maximum usable power.
However, the curve shape must never be evaluated without the corresponding measurement conditions. Irradiance primarily influences current, while increased module temperature particularly reduces voltage. These effects must therefore be recorded simultaneously and taken into account when comparing the measurement with manufacturer data.
A comparison between identical strings under conditions that are as similar as possible is particularly informative. If only one generator branch deviates significantly, troubleshooting can first be narrowed down to this string and then specifically to individual modules.
Thermography, visual inspection and further electrical measurements complement I-V curve analysis. While the I-V curve shows that the electrical behavior deviates and indicates the form of that deviation, additional test methods can help locate the actual physical cause.
The decisive question is therefore not simply: “Does the string reach its expected open-circuit voltage?”, but rather: “Does its complete current-voltage behavior under the actually measured irradiance and temperature conditions match the expected behavior of the PV generator?”
FAQ: PV I-V Curve Measurement
What is an I-V curve of a solar module?
The I-V curve describes the relationship between current and voltage of a PV module or string over the complete operating range. It extends from the short-circuit current at nearly 0 V to the open-circuit voltage at practically 0 A and contains the Maximum Power Point between these two endpoints.
Why is open-circuit voltage alone not sufficient for testing a PV module?
Open-circuit voltage describes only one operating point without significant load current. Faults such as increased series resistance, mismatch or active bypass paths may have a much greater effect under load or within the I-V curve.
What does shading look like in an I-V curve?
Partial shading can produce steps, notches or significant changes in curve slope. The cause is mismatch between differently illuminated cell groups and, where applicable, activation of bypass diodes.
Does a step in the I-V curve mean that a bypass diode is defective?
No. A step initially indicates that different current conditions exist within the generator and that a bypass path may be active. The cause may be shading, local soiling, cell damage or an actual fault in the bypass diode.
Why must irradiance be measured during an I-V curve test?
The generated PV current depends strongly on solar irradiance. Without knowing the actual irradiance reaching the module, a low current cannot reliably be distinguished from normal behavior under lower solar irradiance.
Why is module temperature important?
Module voltage is temperature-dependent. With typical crystalline silicon modules, increasing cell temperature particularly reduces open-circuit voltage and MPP voltage. A warm module can therefore operate significantly below its STC voltage values while still being completely functional.
What does STC mean for photovoltaic modules?
STC stands for Standard Test Conditions. Important reference conditions include an irradiance of 1,000 W/m² and a cell temperature of 25 °C. Manufacturer ratings are referenced to these defined conditions.
What is the MPP?
The Maximum Power Point is the operating point at which the product of voltage and current reaches its maximum. It is described by the MPP voltage VMPP and MPP current IMPP.
What does mismatch mean in a PV string?
Mismatch means that modules or cell groups have different electrical characteristics or operating conditions. Because the same current basically flows through all modules in a series-connected string, one current-limited section can affect the performance of the entire string.
Can soiling produce an I-V curve similar to shading?
Yes. Uniform soiling mainly reduces the effective irradiance and therefore the current. Local soiling can affect individual cell groups more strongly and create steps or notches similar to partial shading.
How can increased series resistance be detected?
Increased series resistance typically changes the curve shape in the region from the Maximum Power Point toward the open-circuit voltage. The curve becomes unfavorably rounded, the fill factor and usable power decrease, while Voc may still remain relatively normal.
Should the complete string or every module be measured individually?
For efficient system testing, it is usually useful to compare complete strings first. If an abnormal string is identified, troubleshooting can then be narrowed down specifically to individual modules within that string.
Can an I-V curve measurement uniquely identify a module defect?
Not in every case. The I-V curve can reveal electrical deviations very clearly and provide valuable indications of the type of fault. However, visual inspection, thermography, bypass-diode testing or additional electrical measurements may be required to identify the exact cause.