


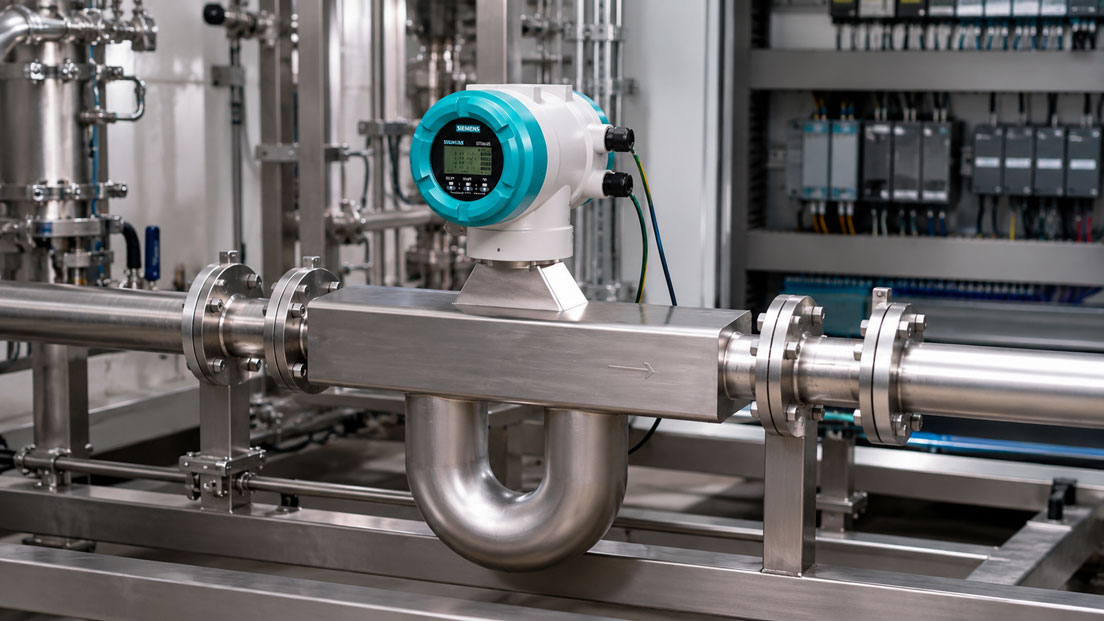
A Coriolis flowmeter often provides considerably more information than a single flow value. In addition to directly measured mass flow, depending on the instrument version it can also output density, temperature, calculated volume flow, totaliser values and diagnostic information.
In practice, however, frequently only one 4–20 mA output is connected to the PLC. Valuable additional information therefore remains unused. At the same time, errors arise when the analogue output is scaled incorrectly, a pulse output is confused with a frequency output or a Modbus value is processed without its associated device status.
Reliable integration therefore begins with a clear definition: Which measured variable is required for control, which values are used for accounting or dosing, and which diagnostic information should detect an uncertain measuring condition at an early stage?
Table of Contents
- Which measured variables does a Coriolis flowmeter provide?
- Comparison of output signals
- Scaling the 4–20 mA output correctly
- Representing bidirectional flow
- Evaluating fault current and signal status
- Distinguishing between pulse and frequency outputs
- Using HART for additional measured values and diagnostics
- Integrating Modbus correctly into the PLC and control system
- Which diagnostic values are useful in practice?
- Systematically testing signals and the measuring chain
- Practical example of a dosing system
- Defining the correct output configuration
- Which measuring instruments / products are suitable?
- Conclusion
- Frequently asked questions
Which measured variables does a Coriolis flowmeter provide?
The Coriolis measuring principle directly detects mass flow through the flow-dependent deformation or phase shift of the vibrating measuring tubes. The density of the medium is additionally determined from the vibration behaviour of the tubes. An integrated temperature sensor is used, among other things, to compensate the measuring system and can also be output as a process value by many instruments.
Additional values can be calculated from these variables:
- mass flow, for example in kg/h or t/h,
- density, for example in kg/m³ or g/cm³,
- process temperature,
- volume flow calculated from mass flow and density,
- forward, reverse and net totalisers,
- batch or dosing quantity,
- depending on the transmitter, concentration, fraction or other derived variables.
Not every measured variable is equally suitable for every task. For gravimetric dosing, mass flow is usually the decisive control variable. For quality monitoring, however, density may be more important. A volume flow value is only reliable if the density measurement is plausible under the actual process conditions.
Comparison of output signals
| Output | Typical use | Strengths | Important limitation |
|---|---|---|---|
| 4–20 mA | Instantaneous value for PLC, controller or display | Robust, simple and suitable for long cable runs | Normally only one scaled process variable per output channel |
| HART | Additional values, parameterisation and diagnostics via the current loop | Uses the existing 4–20 mA cable | Requires a compatible master, suitable loop load and correct network design |
| Pulse output | Total quantity, dosing and counter input | Direct quantity-related counting | Pulse value, pulse width and maximum frequency must be compatible |
| Frequency output | Instantaneous flow represented as a frequency | High resolution and rapid evaluation are possible | Must not be confused with a quantity-related pulse output |
| Modbus RTU | Multiple process and diagnostic values via RS-485 | Large amount of data via one bus connection | Registers, data type, byte order and status bits must be evaluated correctly |
| Relay or switching output | Limit value, flow direction or device status | Simple binary indication | Does not provide a continuous measured value |
A combination is often useful: mass flow is transmitted via 4–20 mA for fast control, the quantity is counted via a pulse output and diagnostic values are additionally read digitally.
Scaling the 4–20 mA output correctly
The 4–20 mA output maps a configured measuring span linearly onto the current signal. In the PLC, the lower and upper range values must correspond exactly to the settings in the Coriolis transmitter.
The following formula applies for linear scaling:
Measured value = lower range value + (current − 4 mA) / 16 mA × measuring span
For example, a mass flowmeter is configured for 0 to 6,000 kg/h. At an output current of 13.6 mA, the result is:
(13.6 mA − 4 mA) / 16 mA × 6,000 kg/h = 3,600 kg/h
Typical errors occur when:
- kg/h is configured in the transmitter but t/h is stored in the PLC,
- the transmitter is scaled for 0 to 6,000 kg/h and the PLC for 0 to 10,000 kg/h,
- mass flow and volume flow are confused,
- a second current output has been assigned to a different measured variable,
- low-flow cut-off sets small actual flow rates to zero,
- damping is set too high both in the transmitter and additionally in the PLC.
During commissioning, not only 4 and 20 mA should be checked. A value in the middle of the measuring span and the configured fault currents should also be tested.
Representing bidirectional flow
Many Coriolis measuring instruments can detect forward and reverse flow. The analogue signal must be configured so that the PLC can distinguish clearly between both directions.
One possible scaling is:
- 4 mA = −1,000 kg/h,
- 12 mA = 0 kg/h,
- 20 mA = +1,000 kg/h.
This representation is well suited to reversible pumps, loading and unloading processes or backflow. However, it halves the resolution available for each flow direction.
Alternatively, the magnitude of the flow can be transmitted as an analogue signal and the direction indicated via a digital output. Another option is the fully digital transmission of a signed measured value and status.
Before configuration, it must also be defined how the totalisers should operate. Depending on the application, separate forward and reverse totalisers or a signed net totaliser are required.
Evaluating fault current and signal status
A 4–20 mA signal should not be evaluated exclusively within the normal measuring span. When a device or measurement fault is detected, many transmitters can output a current below or above the regular range.
Common configurations include, for example, a fault current below 4 mA or above 20 mA. The specific values and behaviour must be checked in the transmitter and coordinated with the PLC programming.
The PLC should distinguish at least between the following conditions:
- valid process value,
- under-range or over-range of the configured measuring range,
- configured device fault,
- open circuit or missing loop power supply,
- short circuit or implausibly high current.
There is an important difference between a process alarm and a device fault. Excessive mass flow may be a valid measured value. A fault current, by contrast, indicates that the transmitted process value may no longer be reliable.
With digital communication, the associated quality or status value should always be processed together with the numerical value. Otherwise, an apparently plausible measured value may continue to be used even though the instrument has already marked it as uncertain or invalid.
Distinguishing between pulse and frequency outputs
Quantity-related pulse output
With a pulse output, each pulse corresponds to a defined mass or volume. One setting could, for example, be:
1 pulse = 0.1 kg
For a measured batch quantity of 1,250 kg, the counter must therefore register 12,500 pulses.
The pulse value must not be selected too small. Otherwise, at high flow rates the output frequency will exceed the permissible frequency of the transmitter or the PLC counter input.
The following must also be checked:
- active or passive output circuit,
- required external power supply,
- pulse polarity,
- pulse width and minimum pause time,
- maximum output frequency,
- maximum counting frequency of the PLC,
- behaviour during reverse flow.
Flow-proportional frequency output
With a frequency output, the frequency corresponds to the instantaneous flow. For example, 0 to 1,000 Hz may represent a measuring range of 0 to 6,000 kg/h.
A frequency of 600 Hz then represents:
600 Hz / 1,000 Hz × 6,000 kg/h = 3,600 kg/h
The frequency output is suitable for fast control systems and counter modules, but it must be scaled differently from a quantity-related pulse output. The terms “pulse” and “frequency” are sometimes stated together in product documentation. The actual parameterisation of the output channel is therefore decisive.
Using HART for additional measured values and diagnostics
With HART, a digital communication signal is superimposed on the existing 4–20 mA current loop. The analogue current can continue to transmit the primary process value, while additional variables, parameters and diagnostic information are available digitally.
Depending on the transmitter, the following values may be read via HART, for example:
- mass flow,
- density,
- temperature,
- volume flow,
- totalisers,
- device status and warning messages,
- measuring range and damping settings,
- device, sensor and identification data.
A suitable loop load is required for stable HART communication. The control system, HART multiplexer or handheld communicator must also support the device description or commands being used.
A loop calibrator with an integrated 250 Ω resistor can provide the required communication resistance. However, it does not replace a complete HART communicator and does not automatically read all device parameters.
Integrating Modbus correctly into the PLC and control system
Modbus RTU enables multiple process, totaliser and diagnostic values to be transmitted via an RS-485 connection. This allows a Coriolis measuring instrument to be integrated more comprehensively than with individual analogue outputs.
For correct integration, the following parameters must correspond:
- device address,
- baud rate,
- parity and number of stop bits,
- two-wire or four-wire structure,
- termination and biasing of the RS-485 bus,
- register number and function code,
- data type and number of registers,
- byte and word order,
- unit and scaling factor,
- polling cycle and timeout.
A typical error is the incorrect interpretation of a 32-bit floating-point value. If the two 16-bit registers are combined in the wrong order, a significantly incorrect or apparently random numerical value is produced.
The register numbering must also be considered. Some documentation begins with register zero, while PLC systems use a representation offset by one. The register address should therefore be verified using a known process value.
Polling must not place an unnecessary load on the bus or PLC. A diagnostic value that changes only slowly does not need to be read in the same cycle as the mass flow required for control.
Which diagnostic values are useful in practice?
In addition to process values, modern Coriolis transmitters monitor numerous internal operating parameters. The available diagnostic variables depend on the respective model and function package.
| Diagnostic information | Possible meaning | Practical response |
|---|---|---|
| Measuring-tube drive or drive gain | More energy is required to keep the measuring tubes vibrating | Check for gas bubbles, deposits, high viscosity or external damping |
| Measuring-tube or resonant frequency | Changes depending on density and mechanical condition | Compare with the density value, medium and historical data |
| Signal quality | Assessment of the stability of the sensor signal | If it deteriorates, check the process conditions, vibration and two-phase flow |
| Empty-pipe or two-phase warning | The measuring tubes are not completely filled with a homogeneous phase | Check gas content, cavitation, installation position and process pressure |
| Density outside the range | The medium, filling condition or sensor state is implausible | Check the process condition and density parameterisation |
| Temperature warning | The process or electronics temperature is outside the intended limits | Check the process temperature, insulation and surroundings |
| Zero-point or stability warning | The zero point is unstable or the process was not completely stopped during zero adjustment | Check valves, backflow, vibration and zero adjustment |
A diagnostic value alone does not prove a sensor fault. An increased drive value can, for example, be caused by air bubbles, high viscosity or deposits. The combination of process values, device status and the trend over time is particularly informative.
Systematically testing signals and the measuring chain
If a reading is implausible, the measuring chain should be checked in separate steps:
- Check the process value and device status directly on the Coriolis transmitter.
- Document the configuration of the measured variable, unit, measuring range and output channel.
- Measure the 4–20 mA signal directly at the output or in the current loop.
- Simulate the PLC input with defined current values independently of the Coriolis instrument.
- Test the pulse or frequency output using a suitable counter or frequency meter.
- Read the Modbus registers using a suitable master or service tool.
- Compare the digital measured values and status flags with the analogue display.
- Only then assess the process, sensor and mechanical installation.
The Druck UPS4E loop calibrator can be used to measure the actual output current or simulate a defined current for testing the PLC input. The integrated loop power supply assists with passive circuits, while step and ramp functions enable rapid scaling checks.
Successful simulation of the PLC input confirms the wiring, input card and scaling. However, it does not test the actual flow measurement, density, temperature, pulse output or Modbus communication of the Coriolis instrument.
Practical example: Output signals in a dosing system
In a dosing system, a liquid raw material is filled in batches. The Coriolis flowmeter is configured as follows:
- 4–20 mA for a mass flow of 0 to 6,000 kg/h,
- pulse output with 0.1 kg per pulse,
- Modbus for density, temperature and diagnostic values,
- separate digital output for device status.
During dosing, the PLC indicates a current of 13.6 mA. This corresponds to a mass flow of 3,600 kg/h. For a batch of 1,250 kg, the control system expects 12,500 pulses.
During one batch, the pulse counter reaches the target value even though the weighed quantity in the vessel is too low. At the same time, the transmitter intermittently reports unstable density and a two-phase-flow warning.
The inspection shows that air is entering the medium through a leaking suction line. The analogue flow value remains temporarily plausible, but the measurement quality is impaired. Only the digital diagnostics make it clear that the measured values must not be used without restriction during these periods.
After the line is sealed, the density, mass flow and pulse count stabilise. The example shows why the process value alone is not always sufficient without diagnostic information.
Defining the correct output configuration
The output configuration should be defined during instrument selection and PLC planning. Missing output channels or communication options cannot be added subsequently to every version without a hardware modification.
The following information in particular is required for configuration:
- required process variables and units,
- minimum and maximum flow,
- forward or bidirectional measurement,
- number of required analogue outputs,
- required assignment of mass flow, density and temperature,
- pulse value or frequency range,
- totalisers for forward, reverse or net quantity,
- HART, Modbus or other communication requirements,
- required diagnostic and status information,
- active or passive inputs and outputs,
- Ex, SIL, hygienic or legal-metrology requirements,
- documentation and calibration requirements.
A fast analogue output may be useful for a critical control variable, while Modbus additionally transmits diagnostic and quality data. For filling or consumption measurement, a separately evaluated pulse output provides a traceable quantity-related interface.
Which measuring instruments / products are suitable?
Coriolis flowmeters and transmitters
The Coriolis / Vortex category includes Coriolis measuring systems for small, medium and very high mass flow rates. Depending on the version, compact or remote transmitters, different process connections and various communication options are available.
Depending on the model, the available SITRANS FC systems measure mass flow, density, temperature and volume flow. Transmitters such as the FCT020 and FCT040, as well as systems such as the FC310 or FC330, provide analogue, digital and diagnostic functions for integration into PLCs and control systems, depending on the configuration.
The final selection must be based on the medium, flow range, nominal pipe size, pressure, temperature, materials, accuracy, output configuration and communication system.
Druck UPS4E loop calibrator
The Druck UPS4E is suitable for commissioning and troubleshooting the 4–20 mA outputs of a Coriolis transmitter.
It can measure and simulate current signals, provide a 24 V loop power supply and output defined test values using step and ramp functions. The integrated 250 Ω resistor supports the connection of a HART communication device.
Additional suitable test equipment or communication tools are required for pulse, frequency and Modbus testing.
Conclusion: Only combining the signals makes full use of the Coriolis measurement potential
A Coriolis flowmeter does not provide only mass flow. Density, temperature, volume flow, totalisers and diagnostic information can be used for control, quality assurance, filling and predictive maintenance.
The 4–20 mA output remains a robust interface for continuous process values. Pulse and frequency outputs are suitable for quantity and rate information, while HART or Modbus transmit additional variables, device status and diagnostic values.
It is essential that the measuring range, unit, direction, fault behaviour and output assignment correspond in the transmitter and PLC. Digital numerical values should never be processed without the associated status information.
During troubleshooting, the sensor, output, wiring and PLC input must be tested separately. A loop calibrator can reliably check the analogue section of the measuring chain, but it does not replace testing of the actual flow or digital communication.
Frequently asked questions about Coriolis output signals
Can a Coriolis flowmeter output several measured values simultaneously?
Yes. Depending on the transmitter, mass flow, density, temperature, volume flow and totaliser values can be provided simultaneously via several outputs or a digital protocol. The exact equipment depends on the configuration.
Should mass flow or volume flow be transmitted via 4–20 mA?
This depends on the application. Mass flow is usually more suitable for dosing and mass balances. If volume flow is required, it should be taken into account that this value is calculated from mass flow and measured density.
What is the difference between a pulse output and a frequency output?
A quantity-related pulse represents a defined mass or volume. A frequency, by contrast, normally represents the instantaneous flow. The parameterisation of the specific output is decisive.
How is reverse flow transmitted via 4–20 mA?
One option is symmetrical scaling, in which, for example, 12 mA represents zero flow. Alternatively, the direction can be transmitted via a separate status output or digitally.
Why do the analogue value and Modbus value not correspond?
Possible causes include different measured variables, units, damping settings or update times. An incorrect register address, byte order or scaling can also distort the digital value.
Can the UPS4E completely test a Coriolis flowmeter?
No. The UPS4E can measure the 4–20 mA output and simulate the PLC input. However, it does not test the Coriolis measuring principle, actual flow accuracy, pulse output or Modbus data.
Which diagnostic values should be stored in the PLC?
At a minimum, the device status, measured-value quality and relevant warnings should be stored. Depending on the application, density, temperature, drive value, two-phase warning and zero-point status can additionally be stored for trend analyses.
Which information does ICS Schneider require for product selection?
The required information includes the medium, minimum and maximum mass or volume flow, density, viscosity, pressure, temperature, nominal pipe size, materials, process connections, accuracy requirements, required output signals, communication protocol, diagnostic requirements and, where applicable, Ex, SIL, hygienic or legal-metrology requirements.