


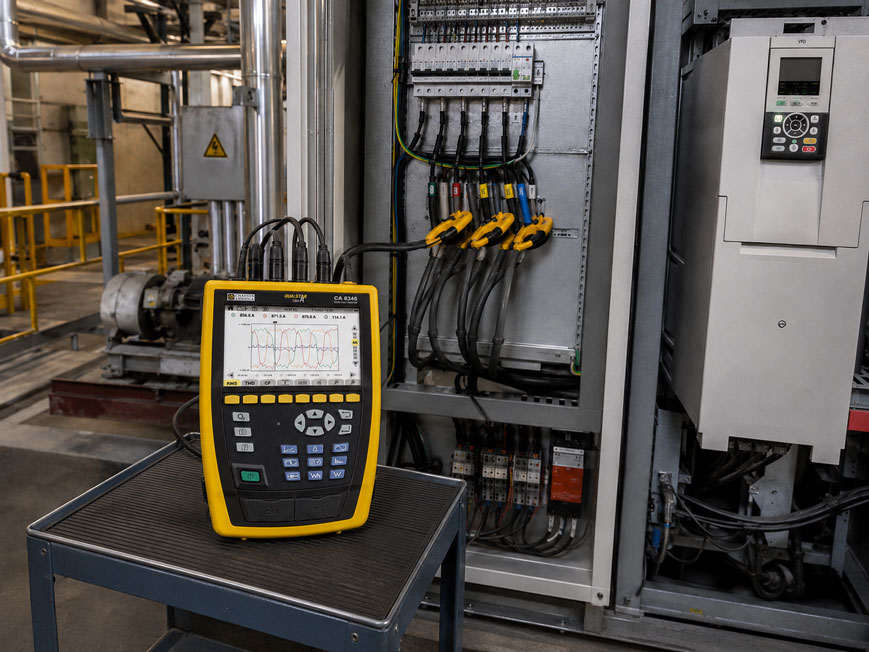
A variable frequency drive may, for example, show a cos φ of 0.98 on the mains side, while the power analyzer measures a total power factor of only 0.88. At first glance, one of the two values appears to be incorrect. In fact, both measured values can be correct at the same time.
The reason lies in the current waveform. With a sinusoidal load, the phase angle between voltage and current describes the power factor very well. A variable frequency drive, however, is a nonlinear load. Its input circuit can draw a strongly distorted current even though the fundamental component of the current is only slightly phase-shifted relative to the voltage.
This results in two different perspectives: The displacement factor or Displacement Power Factor essentially describes the phase displacement of the fundamental components. The True Power Factor or total power factor, on the other hand, takes the entire RMS current consumption, including harmonics, into account.
In systems with variable frequency drives, a good cos φ is therefore not sufficient to assess the actual load on the electrical network. The total power factor PF, current distortion, harmonics and actual apparent power must also be considered.
Suitable measuring instruments can be found at ICS Schneider under Electrical Measuring and Test Equipment and specifically under Power and Energy Analyzers and Energy Recorders.
For detailed power network analysis, for example, the CA 8345 Power Analyzer is suitable. The device calculates both the Displacement Power Factor DPF and the Power Factor PF and additionally records harmonics and various power quantities. For longer-term energy and load recordings, the PEL 113 Power and Energy Recorder is also available and records cos φ, tan φ, PF, active, reactive and apparent power as well as THD.
Table of Contents
- Why cos φ and power factor are not always the same
- Distinguishing between active, reactive and apparent power
- What cos φ actually describes
- What the True Power Factor describes
- When cos φ and PF are identical
- Why variable frequency drives reveal the difference
- How harmonics reduce the power factor
- Relationship between DPF, THD and total power factor
- Calculation example: cos φ 0.98 and PF only 0.88
- Do not confuse reactive power with distortion power
- Distinguishing between the mains side and motor side of a variable frequency drive
- Choosing the correct measuring point
- Correctly connect the power analyzer
- Correctly assign current sensors and current direction
- Why the power factor can depend on load
- Why reactive power compensation does not automatically improve the True PF
- Carefully evaluate capacitors and variable frequency drives
- Consequences of a low True Power Factor
- Correctly interpret THD
- Why long-term recording is often better than a snapshot
- Systematically diagnose cos φ and PF
- Typical fault patterns in practice
- Practical example: variable frequency drive with good cos φ and poor PF
- Practical example: measuring an entire machine distribution system
- Selecting a suitable measuring instrument
- Suitable power analyzers at ICS Schneider
- Conclusion
- FAQ
Why cos φ and power factor are not always the same
In conventional AC circuits, the terms:
cos φ
and:
power factor
are often used almost synonymously.
With purely sinusoidal voltage and sinusoidal current, this is also largely correct.
However, with the increasing use of power electronic loads, this simplification becomes problematic.
Typical nonlinear loads include:
- variable frequency drives,
- switch-mode power supplies,
- UPS systems,
- LED power supplies,
- rectifiers,
- chargers,
- servo drives.
These devices often do not draw sinusoidal current.
As a result:
cos φ ≠ PF
may apply.
Distinguishing between active, reactive and apparent power
To assess the power factor, the fundamental power quantities must first be distinguished.
Active power P
Active power is the portion of electrical power that is actually converted into another form of energy.
Examples include:
- mechanical power of a motor,
- heat,
- light,
- process energy.
The unit is:
W or kW
Apparent power S
Apparent power is calculated from the RMS values of voltage and current.
For a single-phase system:
S = URMS × IRMS
The unit is:
VA or kVA
For a balanced three-phase system, the following simplified equation can be used:
S = √3 × ULL × I
Reactive power Q
Under sinusoidal conditions, reactive power describes the exchange of power between the source and reactive components such as:
- inductors,
- motor windings,
- transformers,
- capacitors.
The unit is:
var or kvar
Under ideal sinusoidal conditions
S² = P² + Q²
This classic power triangle works very well for sinusoidal voltages and currents.
However, with strongly distorted current waveforms, this representation is no longer sufficient.
What cos φ actually describes
Cos φ describes the cosine of the phase angle between voltage and current.
For sinusoidal signals:
cos φ = P / S
For distorted signals, modern power analyzers usually consider the angle between the fundamental components of voltage and current.
Terms used for this include:
- Displacement Power Factor,
- DPF,
- displacement factor,
- Fundamental Power Factor,
- cos φ1.
In simplified form
DPF = cos φ1
Here, φ1 is the phase displacement between the voltage fundamental and the current fundamental.
Whether significant current components are additionally present at:
250 Hz
350 Hz
or other harmonic frequencies is not adequately described by this value alone.
What the True Power Factor describes
The total power factor, on the other hand, takes into account the actual active power in relation to the total apparent power.
For single-phase systems:
PF = P / S
or:
PF = P / (URMS × IRMS)
This value is commonly referred to as:
- Power Factor PF,
- Total Power Factor,
- True Power Factor,
- total power factor.
The decisive difference
The True Power Factor takes the entire RMS current consumption into account.
This therefore also includes current components caused by:
- harmonics,
- nonlinear current consumption,
- distorted current waveforms.
The PF therefore provides a better answer to the question of how much mains current or apparent power is required to transmit a certain amount of active power.
When cos φ and PF are identical
With an ideally sinusoidal supply and sinusoidal current consumption:
PF = cos φ
Example
An inductive motor draws an almost sinusoidal current and has:
cos φ = 0.8
The total power factor is then also approximately:
PF ≈ 0.8
The unfavorable power factor is caused mainly by the phase displacement between current and voltage.
The situation changes with nonlinear loads
If the current is strongly distorted, the following values may occur, for example:
cos φ = 0.98
but:
PF = 0.88
The main reason is then not a large phase displacement, but an additional distortion component in the current.
Why variable frequency drives reveal the difference
A conventional variable frequency drive typically consists, in simplified form on the mains side, of:
mains → rectifier → DC link → inverter → motor
Many conventional units use a diode rectifier at the input.
The DC link is not charged evenly over the entire sinusoidal period.
The mains current can therefore be pulse-shaped or deviate significantly from a sine wave.
The fundamental component can nevertheless be almost in phase
The displacement factor can therefore be very good, for example:
DPF or cos φ ≈ 0.95 … 1
However, the total RMS current additionally contains harmonic components.
The apparent power therefore increases more than the actual transmitted active power.
The True Power Factor decreases.
Not every variable frequency drive behaves in the same way
The current spectrum depends, among other things, on:
- input rectifier,
- DC-link choke,
- line reactor,
- passive filters,
- active front end,
- load condition,
- network impedance.
Variable frequency drives with an Active Front End can therefore exhibit significantly different mains behavior compared with conventional 6-pulse diode rectifiers.
How harmonics reduce the power factor
A non-sinusoidal current waveform can mathematically be divided into a fundamental component and harmonics.
In a 50 Hz power system, the fundamental frequency is:
50 Hz
Typical harmonic frequencies include:
5th harmonic = 250 Hz
7th harmonic = 350 Hz
11th harmonic = 550 Hz
13th harmonic = 650 Hz
With certain rectifier circuits, characteristic harmonics are particularly pronounced.
These currents load the electrical network
They contribute to the total RMS current and can, among other things:
- increase heating of cables,
- increase transformer loading,
- cause voltage distortion,
- increase losses,
- promote resonance.
Cos φ alone does not fully represent this load.
Relationship between DPF, THD and total power factor
With an almost sinusoidal mains voltage, the relationship can be illustrated clearly.
The current distortion factor can be described in simplified form as:
DF = I1 / IRMS
Where:
I1= RMS value of the current fundamental,IRMS= total RMS current including harmonics.
The following therefore applies approximately:
PF ≈ DPF × DF
or:
PF ≈ cos φ1 × I1 / IRMS
Relationship with current THD
If the current THD is referenced to the fundamental and no relevant DC component is present:
DF = 1 / √(1 + THDI²)
This results in:
PF ≈ cos φ1 / √(1 + THDI²)
This simplified relationship assumes a largely sinusoidal voltage. If the mains voltage is significantly distorted, a complete power analysis must be used.
Calculation example: cos φ 0.98 and PF only 0.88
A variable frequency drive has the following value on the mains side:
cos φ1 = 0.98
The current distortion is:
THDI = 50 % = 0.50
Step 1: Calculate the distortion factor
DF = 1 / √(1 + 0.50²)
DF ≈ 0.894
Step 2: Determine the total power factor
PF ≈ 0.98 × 0.894
PF ≈ 0.876
The following values can therefore be measured simultaneously on the same load:
cos φ ≈ 0.98
and:
True PF ≈ 0.88
Both values are correct
Cos φ shows that the current fundamental is only slightly phase-shifted relative to the voltage.
The True Power Factor, on the other hand, shows that significantly more total current is required to transmit the active power because of the distorted current waveform.
Do not confuse reactive power with distortion power
In a sinusoidal AC system, the portion of apparent power that is not converted into active power can largely be described by reactive power.
With nonlinear loads, this interpretation is no longer sufficient.
A variable frequency drive may, for example, have
cos φ close to 1
and nevertheless:
PF significantly below 1
.
The difference cannot then simply be interpreted entirely as conventional inductive reactive power.
Additional components are caused by distortion of the current waveform.
Modern power analyzers therefore distinguish between additional quantities
The CA 8345, for example, records or calculates:
- active power
P, - fundamental reactive power
Q1, - apparent power
S, - non-active power
N, - distortion power
D, - DPF,
- PF.
This makes it much easier to determine why the total power factor deviates from 1.
Distinguishing between the mains side and motor side of a variable frequency drive
When measuring variable frequency drives, it must be clearly defined where the measurement is being performed.
Mains input of the variable frequency drive
Relevant quantities include, for example:
- mains current,
- active power,
- apparent power,
- PF,
- DPF or cos φ,
- current THD,
- voltage THD,
- harmonic spectrum.
This measuring point is decisive for assessing the mains effects of the variable frequency drive.
Output of the variable frequency drive to the motor
There is no conventional sinusoidal mains voltage at this point.
The output voltage is generated by rapid semiconductor switching and is typically pulse-width modulated.
A conventional mains power measurement may therefore be unsuitable on the motor side.
For motor and drive measurements
the measuring instrument used must be explicitly suitable for:
- PWM signals,
- the required bandwidth,
- motor power analysis,
- variable frequency drive outputs.
A power factor measured at the mains input must not be equated with an assumed cos φ on the PWM motor side.
Choosing the correct measuring point
The measuring point depends on the question being investigated.
Assessing an individual variable frequency drive
Measurement should then preferably be performed directly at the supply point of the variable frequency drive.
This allows its:
- current waveform,
- power,
- PF,
- DPF,
- harmonics
to be investigated specifically.
Assessing the effects on a distribution system
In this case, measurement at the relevant sub-distribution board is useful.
The combined effect of all connected loads can be measured there.
Assessing the effects on the entire power network
For questions concerning harmonic loading and network disturbances, the:
Point of Common Coupling – PCC
is often also relevant.
The appropriate measuring point depends on the system, responsibility boundary and specific question.
Correctly connect the power analyzer
A power factor measurement is only as reliable as the electrical connection of the measuring instrument.
In a three-phase system, the following must be correct, among other things
- network configuration,
- voltage assignment L1, L2 and L3,
- current assignment L1, L2 and L3,
- neutral conductor connection, if required,
- current sensor direction,
- phase sequence.
Typical error
The current sensor assigned to L1 is actually installed on L2.
The measuring instrument then combines the voltage of one phase with the current of another phase.
Possible consequences include:
- implausible active power,
- negative power factor,
- unusual phase angle,
- incorrect reactive power.
Before starting a longer measurement campaign, the phasor diagram or connection check of the analyzer should therefore always be verified first.
Correctly assign current sensors and current direction
Current clamps and flexible current sensors have a defined measuring direction.
This is often indicated by:
- an arrow,
- a marking,
- labeling.
If the direction is incorrect
the active power may, for example, be displayed as negative.
For a normal load, this can appear as if energy is being fed back into the grid.
However, not every negative power value indicates a connection error
Regenerative variable frequency drives or Active Front End systems can actually feed energy back into the mains.
It is therefore necessary to distinguish between:
current sensor installed in the wrong direction
and:
actual reverse energy flow
.
The sign convention for PF and reactive power should also be checked in the operating instructions of the measuring instrument used.
Why the power factor can depend on load
The power factor of a variable frequency drive is not a fixed device parameter.
It can change with the operating condition.
Influencing factors include
- motor load,
- speed,
- DC-link voltage,
- rectifier topology,
- line reactor,
- DC-link choke,
- filters,
- network impedance.
A measured value at:
20 % machine load
therefore does not necessarily represent the value at:
100 % production load
.
The harmonic spectrum can also change
A single snapshot can therefore incorrectly characterize a system.
For production machines with changing operating conditions, trend recording over a complete machine or production cycle is often significantly more informative.
Why reactive power compensation does not automatically improve the True PF
Conventional reactive power compensation using capacitors primarily corrects a phase displacement between voltage and current.
It therefore acts on the:
Displacement Power Factor or cos φ
.
Harmonic currents do not automatically disappear
If, for example:
cos φ = 0.98
and:
PF = 0.82
the main cause is clearly not a large fundamental-frequency phase displacement.
Additional conventional capacitor compensation cannot then solve the actual problem.
Instead, it is necessary to check
- which harmonics are present,
- how large their current components are,
- the existing network impedance,
- which filter or reactor technology is being used.
Carefully evaluate capacitors and variable frequency drives
In a system with a high harmonic load, compensation capacitors must not simply be added because the total power factor is poor.
The reactance of capacitors decreases as frequency increases.
Harmonic currents can therefore place additional stress on the capacitors.
Resonances can also occur
The combination of:
- network inductance,
- transformer,
- line inductance,
- compensation capacitance
can produce resonance at certain frequencies.
Individual harmonics can therefore be significantly amplified.
In a system containing many variable frequency drives, the harmonic spectrum should therefore be investigated before making changes to the reactive power compensation system.
Consequences of a low True Power Factor
A low total power factor means:
More apparent power must be transmitted for the same active power.
This typically also increases the required RMS current.
Possible consequences include
- higher cable losses,
- greater transformer loading,
- lower usable system capacity,
- higher thermal load,
- greater voltage drops.
Example
A single-phase load requires:
P = 10 kW
At:
PF = 1.0
the required apparent power is:
S = 10 kVA
At:
PF = 0.8
it is instead:
S = 10 kW / 0.8 = 12.5 kVA
Although the same active power is transmitted, cables, switching devices and transformers must carry a higher apparent power or current.
Correctly interpret THD
THD stands for:
Total Harmonic Distortion
.
A distinction is made in particular between
THDU or THDV
for voltage and:
THDI
for current.
A variable frequency drive can, for example, have a high current THD while the mains voltage remains comparatively undistorted because the drive is connected to a relatively stiff network.
Current THD and voltage THD answer different questions
Current THD describes distortion of the load current.
Voltage THD indicates how strongly this and other network disturbances are already affecting the supply voltage.
The THD reference definition is also important
Depending on the standard and display method, measuring instruments may reference distortion values to:
- the fundamental component,
- the total RMS value.
For accurate comparisons, it must therefore be checked which definition is used by the measuring instrument.
Why long-term recording is often better than a snapshot
The poorest power factor does not necessarily occur at the moment when the test technician is standing in front of the control cabinet.
Production systems continuously change:
- speeds,
- motor loads,
- number of active drives,
- heating power,
- process conditions.
As a result, the following also change:
- active power,
- apparent power,
- PF,
- cos φ or DPF,
- THD,
- harmonic spectrum.
Trend recording therefore allows
a comparison of:
electrical measured value ↔ machine condition ↔ time
.
For example, it may reveal that the PF always drops significantly when several variable frequency drives are simultaneously operating at low partial load.
Systematically diagnose cos φ and PF
- Define the objective: Investigate an individual variable frequency drive, a sub-distribution board or the entire system.
- Define the measuring point: Select the drive supply or a suitable distribution point.
- Configure the network type: Correctly set single-phase, three-phase 3-wire or three-phase 4-wire.
- Assign voltages: Correctly connect L1, L2, L3 and N if required.
- Assign current sensors: Assign each current clamp to the correct voltage phase.
- Check current direction: Verify arrow direction and energy flow.
- Check the phasor diagram: Exclude connection errors before analysis.
- Record active power: Check total values and phase values where appropriate.
- Record apparent power: Evaluate its relationship to active power.
- Measure PF: Determine the actual total power factor.
- Measure DPF or cos φ: Evaluate the displacement component separately.
- Compare PF and DPF: A large difference indicates significant distortion effects.
- Measure THD: Evaluate current and voltage distortion separately.
- Check the harmonic spectrum: Identify unusual harmonics.
- Document the load condition: Record speed, motor load and machine status.
- Record trends: For changing loads, record a complete production cycle.
- Check compensation: Consider existing capacitor banks and filters before making modifications.
- Define corrective measures: Only after completing the analysis should reactors, filters, active front ends or other solutions be evaluated.
Typical fault patterns in practice
| Observation | Possible cause | Recommended check |
|---|---|---|
| cos φ ≈ 1, PF significantly lower | strong current distortion | measure THDI and harmonics |
| cos φ and PF almost identical | low distortion or predominantly linear load | confirm current waveform and THDI |
| PF becomes worse at partial load | changed current waveform or higher distortion relative to active power | record PF and THDI across the load range |
| PF is negative | incorrect current sensor direction or actual regenerative operation | check current direction and energy flow |
| One phase has a completely different PF | connection error or unbalanced load | check phase assignment and loads |
| Active power appears implausibly low | current clamps interchanged or incorrect transformer ratio | check connection and sensor configuration |
| Current THD high, voltage THD low | nonlinear load connected to a relatively stiff network | evaluate network impedance and PCC |
| Voltage THD increases at higher production load | harmonic currents cause greater mains voltage distortion | compare trends of load, THDI and THDU |
| Capacitor bank becomes unusually hot | harmonic loading or resonance possible | investigate current spectrum and compensation system |
| cos φ improves after compensation, PF hardly changes | distortion component remains | compare THDI and True PF |
| Measured values at the VFD output are implausible | measuring instrument unsuitable for PWM output | check suitability for drive/motor analysis |
| PF fluctuates considerably during the day | changing number and loading of nonlinear loads | perform long-term recording |
Practical example: variable frequency drive with good cos φ and poor PF
The following values are measured at the input of a three-phase variable frequency drive:
U = 400 V
I = 30 A
P = 18.2 kW
With an approximately balanced load, the apparent power is:
S ≈ √3 × 400 V × 30 A
S ≈ 20.8 kVA
True Power Factor
PF = P / S
PF ≈ 18.2 / 20.8
PF ≈ 0.88
At the same time, the analyzer displays
DPF or cos φ = 0.98
This immediately shows:
The poor utilization of apparent power is not mainly caused by a large inductive phase displacement.
Next diagnostic step
The current THD and harmonic spectrum are examined.
If significant current distortion is detected, it explains the difference between:
DPF = 0.98
and:
PF = 0.88
.
Incorrect conclusion
PF is poor → install more compensation capacitors
Better conclusion
DPF is already good → analyze distortion component and harmonics
Depending on the system, the following can then be technically evaluated, for example:
- line reactors,
- DC-link chokes,
- passive harmonic filters,
- active filters,
- other drive topologies.
Practical example: measuring an entire machine distribution system
A production line contains several:
- variable frequency drives,
- servo drives,
- switch-mode power supplies,
- conventional motors.
At the main distribution board, a PF of:
0.84
is temporarily measured.
Cos φ, however, is:
0.96
A snapshot is not sufficient
The individual variable frequency drives operate at different loads depending on the production step.
A long-term recording is therefore started.
The following are recorded:
- active power,
- apparent power,
- PF,
- cos φ or DPF,
- THDI,
- THDU,
- individual harmonics,
- current per phase.
Result
The PF drops particularly during production phases in which several variable frequency drives operate simultaneously at low load.
The DPF, on the other hand, remains relatively high.
This demonstrates that conventional reactive power compensation alone would not eliminate the main cause.
Only by recording PF, DPF and harmonics simultaneously can the electrical load be correctly assessed.
Selecting a suitable measuring instrument
For a reliable assessment of variable frequency drives, the measuring instrument should not display only a single cos-φ value.
Useful measured quantities include
- True RMS voltage,
- True RMS current,
- active power P,
- apparent power S,
- reactive or non-active power,
- Power Factor PF,
- Displacement Power Factor or cos φ,
- THDI,
- THDU,
- harmonic spectrum,
- phase angle,
- trend recording.
For troubleshooting and detailed power quality analysis
a power quality analyzer is useful if it can:
- display waveforms,
- analyze harmonics,
- evaluate individual power quantities separately,
- record events over time.
For long-term energy analyses
a compact energy recorder may be useful that records the following over days or weeks:
- power,
- energy,
- PF,
- cos φ,
- THD.
Suitable power analyzers at ICS Schneider
CA 8345 Power Analyzer
The CA 8345 is a power and power quality analyzer from the Qualistar series.
For the issue described here, it is particularly relevant that the device calculates the following separately:
Displacement Power Factor DPF,Power Factor PF.
This immediately makes it possible to determine whether a poor total power factor results mainly from phase displacement or from distortion effects.
The CA 8345 additionally records
- active power P,
- fundamental reactive power Q1,
- non-active power N,
- apparent power S,
- distortion power D,
- harmonics from DC up to the 63rd order,
- interharmonics,
- voltage and current unbalance,
- trend values,
- transients,
- TrueInrush.
The device is designed as a Class A analyzer in accordance with IEC 61000-4-30 Edition 3.
Particularly useful for variable frequency drives
The combined display of:
PF + DPF + THD + harmonic spectrum + P + S
provides a significantly better diagnosis than considering a cos-φ value in isolation.
PEL 113 Power and Energy Recorder
The PEL 113 is particularly suitable for longer-term energy and load measurements.
It features:
- 3 voltage inputs,
- 3 current inputs,
- voltage measurements up to 1,000 V AC or DC,
- current measurements depending on the current sensor used,
- active, reactive and apparent power measurement,
- active, reactive and apparent energy,
- cos φ,
- tan φ,
- Power Factor PF,
- THD for current and voltage.
The recorder is therefore suitable, for example, for:
- energy audits,
- industrial maintenance,
- long-term measurements,
- load profile analyses.
Which device for which task?
In simplified terms:
detailed power quality and harmonic diagnostics → CA 8345
long-term power and energy recording → PEL 113
The measurement technology required ultimately depends on network configuration, voltage, current, measurement duration and the required depth of analysis.
Conclusion
With sinusoidal loads, cos φ and power factor can be practically identical. With variable frequency drives and other nonlinear loads, however, treating these values as equivalent is often incorrect.
cos φ primarily describes phase displacement
With distorted signals, it typically represents the displacement factor of the fundamental component or DPF.
True Power Factor takes the entire current consumption into account
PF is calculated from active power and total apparent power and therefore also takes the effects of a distorted current waveform into account.
A good cos φ therefore does not automatically mean a good PF
A variable frequency drive can, for example, have a:
cos φ of 0.98
and at the same time a:
PF of 0.88
.
Harmonics are often the decisive difference
They increase the total RMS current and therefore the apparent power without transmitting additional active power in the same proportion.
Conventional reactive power compensation does not automatically solve this problem
If the DPF is already good, the current distortion must primarily be investigated. Additional capacitors in networks with high harmonic loads can even promote unwanted resonance effects.
The measuring point determines what the result means
To assess the mains effects of a variable frequency drive, its input side should be examined. Measurements on the PWM output side to the motor, however, require measuring technology specifically designed for this purpose.
Long-term recording often provides a better diagnosis
PF, DPF and harmonics can change significantly depending on the load condition. A single instantaneous value may therefore not be representative.
For practical applications
Define the measuring point → correctly configure the network type → connect voltage and current with the correct phase assignment → check current sensor direction → measure P and S → determine True PF → record DPF or cos φ separately → evaluate the difference between PF and DPF → measure THDI and THDU → analyze the harmonic spectrum → document the load condition → record trends under changing loads → do not confuse reactive power compensation with harmonic compensation → only then define suitable technical measures.
FAQ: cos φ and True Power Factor with Variable Frequency Drives
What is the difference between cos φ and Power Factor?
With sinusoidal signals, both values are practically identical. With nonlinear loads, cos φ or DPF mainly describes the phase displacement of the fundamental components, while the True Power Factor additionally takes the effects of current distortion into account.
What does True Power Factor mean?
The True Power Factor or total power factor is the ratio of active power to total apparent power: PF = P / S.
What does DPF mean?
DPF stands for Displacement Power Factor and describes the power factor of the fundamental component or the displacement factor between the voltage and current fundamentals.
Is DPF the same as cos φ?
With suitable power analyzers, cos φ is often displayed as the Displacement Power Factor or fundamental power factor.
When does PF = cos φ apply?
With sinusoidal voltage and sinusoidal current without relevant harmonic distortion, PF and cos φ are practically identical.
Why do PF and cos φ differ with variable frequency drives?
Variable frequency drives can draw a strongly non-sinusoidal input current. The current fundamental can be almost in phase with the voltage while harmonic current components increase the total RMS current and therefore the apparent power.
Can a variable frequency drive have cos φ 0.99 and still have a poor power factor?
Yes. A very good displacement factor does not rule out a significantly poorer total power factor if current distortion is high.
Why do variable frequency drives generate harmonics?
The nonlinear rectifier circuit on the mains side does not draw current evenly over the entire sinusoidal period. This results in a distorted current waveform containing harmonic components.
What does THDI mean?
THDI describes the Total Harmonic Distortion of the current.
What does THDU mean?
THDU or THDV describes the Total Harmonic Distortion of the voltage.
Does high current THD automatically mean high voltage THD?
No. In a very stiff network, voltage distortion can initially remain comparatively low despite high current distortion.
How is Power Factor calculated?
The total power factor is fundamentally calculated as PF = P / S.
How is apparent power calculated?
For a single-phase system, S = URMS × IRMS. For a balanced three-phase system, S = √3 × ULL × I can be used.
What is the distortion factor?
With a largely sinusoidal voltage, it can be described as the ratio of the current fundamental to the total RMS current: DF = I1 / IRMS.
How are PF and DPF related?
With a largely sinusoidal voltage, the approximation PF ≈ DPF × DF can be used.
How is THDI related to Power Factor?
Under simplified conditions, PF ≈ cos φ1 / √(1 + THDI²) applies if THD is referenced to the fundamental and the voltage is largely sinusoidal.
What does a PF of 0.8 mean?
It means that active power corresponds to only 80 % of the transmitted apparent power. More RMS current is therefore required for the same active power than with PF 1.
Is a PF of 1 ideal?
Yes. At PF 1, apparent power equals active power.
Is a cos φ of 1 ideal?
In terms of the phase displacement of the fundamental component, yes. However, with a distorted current waveform, the True Power Factor can still be below 1.
What is distortion reactive power?
In non-sinusoidal systems, additional non-active power components arise from harmonic distortion. They must not simply be equated with conventional fundamental-frequency reactive power.
Can I calculate Q from √(S²-P²)?
With purely sinusoidal conditions, the conventional power triangle applies. With strongly distorted signals, however, the resulting non-active power should not automatically be interpreted as conventional phase-shift reactive power.
Why does the CA 8345 measure Q1?
Q1 refers to the reactive power of the fundamental component. This allows it to be evaluated separately from other non-active or distortion-related power components.
Can a poor PF be improved with capacitors?
Only if the main cause is phase displacement. A PF reduced by current harmonics is not automatically corrected by conventional capacitor compensation.
Why can capacitors be problematic with variable frequency drives?
Harmonic currents can place additional stress on capacitors. Resonances can also occur together with the network inductance.
Should I measure directly at the variable frequency drive?
If the mains effects of the drive are to be investigated, measurement at the mains input of the variable frequency drive is useful.
Can I measure the power factor normally at the motor output of a variable frequency drive?
Not with every power measuring instrument. The PWM output voltage places high demands on bandwidth and measurement methods. For this measuring point, the instrument must be explicitly suitable for variable frequency drive and motor analysis.
Why is the direction of the current clamp important?
A current clamp installed in the opposite direction can result in incorrect signs for active power, reactive power and power factor.
Why must voltage and current of the same phase be assigned to each other?
The analyzer requires the correct time relationship between voltage and current of each phase. Interchanged phases lead to incorrect power and phase-angle values.
How can I identify a connection error?
A phasor diagram is particularly useful. Implausible phase angles, negative active power or strongly differing phase values should be investigated.
Can a variable frequency drive actually produce negative active power?
With regenerative drives or Active Front End systems, energy can be fed back from the motor or process into the mains.
Why does PF change with load?
The current waveform and the relationship between the fundamental component, harmonic components and active power can change with the load condition of the variable frequency drive.
Is a short measurement sufficient for a production machine?
Not always. With changing load conditions, at least one representative production cycle should ideally be recorded.
Which values should I measure simultaneously on a variable frequency drive?
Particularly useful values are voltage, current, active power, apparent power, PF, DPF or cos φ, THDI, THDU and the harmonic spectrum.
What does the CA 8345 measure?
The CA 8345 records comprehensive power quality and power parameters including P, Q1, N, S, D, PF, DPF, harmonics, interharmonics, transients and trend values.
Can the CA 8345 display PF and DPF separately?
Yes. The CA 8345 explicitly calculates both the Displacement Power Factor DPF and the Power Factor PF.
Up to which harmonic does the CA 8345 measure?
The manufacturer specifies harmonic measurements from DC up to the 63rd order as well as interharmonics up to the corresponding subgroup of the 62nd order.
Is the CA 8345 a Class A power quality analyzer?
Yes. The CA 8345 is designed for measurement functions in accordance with IEC 61000-4-30 Edition 3 Class A.
What is the PEL 113 suitable for?
The PEL 113 is particularly suitable for energy audits, industrial maintenance and long-term recording of power and energy parameters.
Does the PEL 113 measure cos φ and PF separately?
Yes. The phase parameters specified include cos φ, tan φ and Power Factor PF.
Does the PEL 113 also measure THD?
Yes. The recorder calculates THD for current and voltage.
Which is better for quick troubleshooting: PF or cos φ?
Both values should be considered together. Only the comparison shows whether the cause of a poor power factor is more likely to be phase displacement or distortion.
Where can I find the CA 8345 at ICS Schneider?
Further information can be found under CA 8345 Power Analyzer at ICS Schneider.
Where can I find the PEL 113 at ICS Schneider?
Further information can be found under PEL 113 Power and Energy Recorder at ICS Schneider.
Where can I find further power and energy analyzers?
An overview can be found under Power and Energy Analyzers and Energy Recorders at ICS Schneider.
Where can I find further electrical measuring and test equipment?
An overview can be found under Electrical Measuring and Test Equipment at ICS Schneider.