


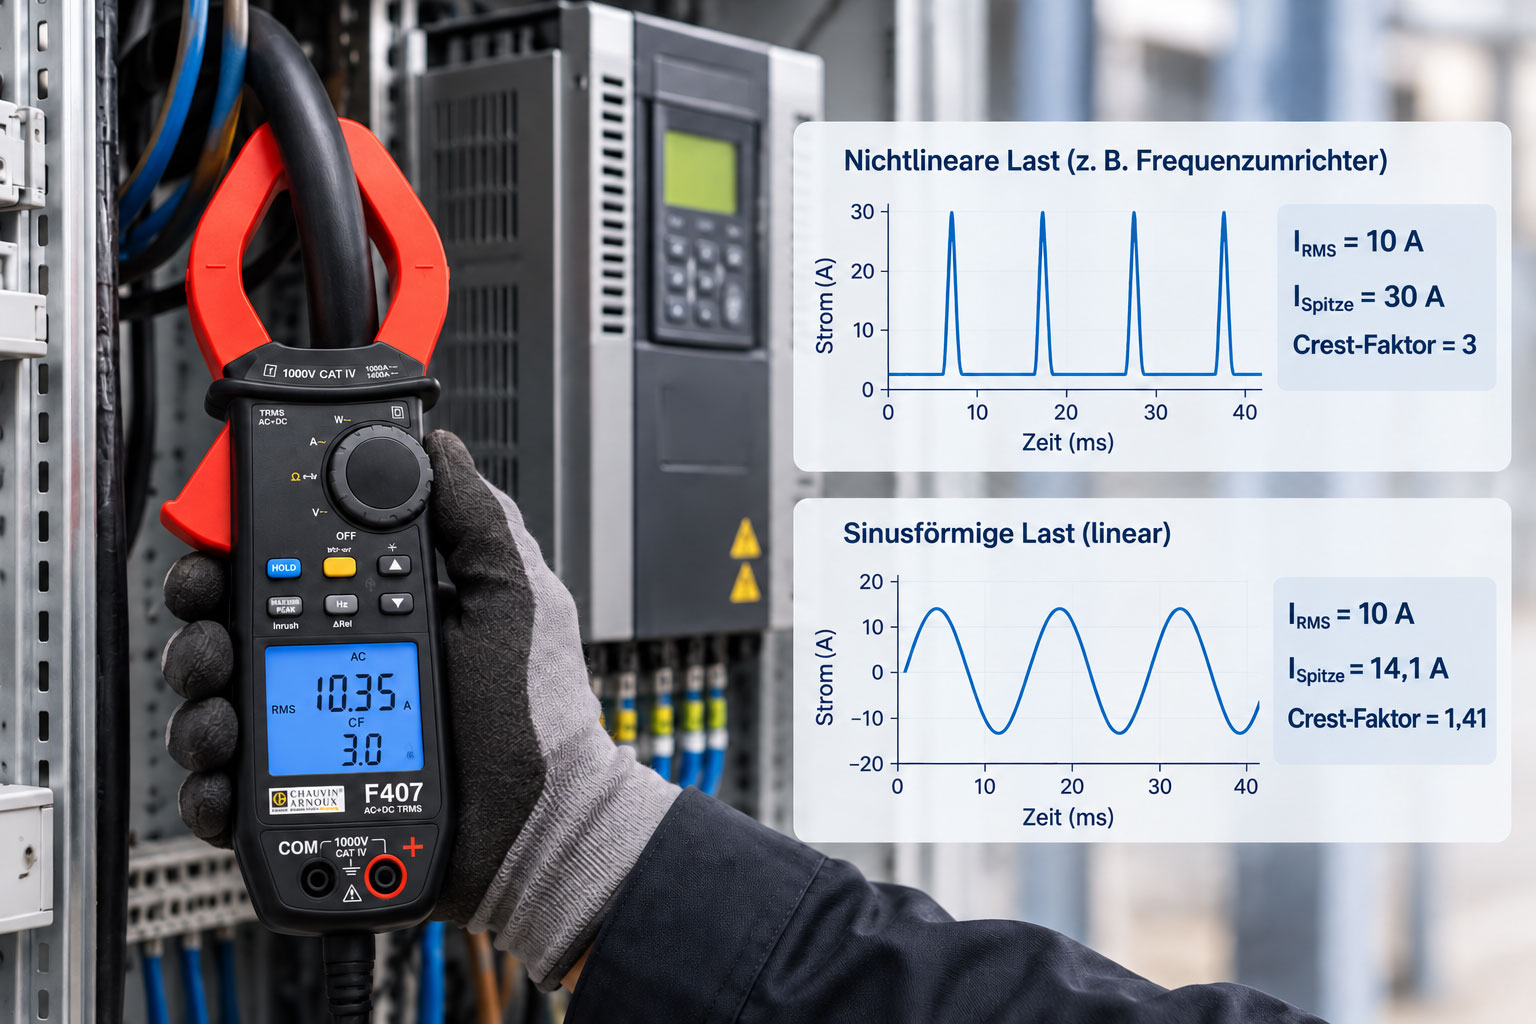
When measuring current on variable frequency drives, switched-mode power supplies, chargers, LED power supplies and other power-electronic loads, True RMS is now one of the most important requirements for the measuring instrument. The reason is simple: Such loads often draw a non-sinusoidal current.
A True-RMS measuring instrument calculates the actual RMS value of the current waveform and is therefore significantly superior to a purely average-responding instrument when measuring distorted waveforms.
However, this quickly leads to a potentially misleading simplification: If a clamp meter is labeled “True RMS” and the displayed current lies within its measuring range, the measured value must automatically be correct regardless of the waveform.
This is not generally the case.
Every real measuring instrument also has limits for peak value, dynamic range, bandwidth and input signal. Particularly with nonlinear loads, a current waveform can contain short, high current peaks even though its RMS value remains comparatively low.
A current of 10 A RMS, for example, can have a peak value of 14.1 A – as with an ideal sine wave. However, it can also contain short peaks of 30 A or 40 A. Both waveforms can have the same RMS value, but they place completely different demands on the measuring instrument.
This characteristic is described by the crest factor.
The crest factor expresses the ratio between the peak value of a waveform and its RMS value. A high value therefore immediately indicates that the current contains pronounced peaks.
True RMS and crest factor therefore answer two different questions. The RMS value describes the effective or thermally relevant current load. The crest factor describes how large the peaks are in relation to this RMS value.
For reliable current measurement on nonlinear loads, both aspects must be taken into account: The instrument must be able to calculate the RMS value correctly while also capturing the actual peaks within its permissible input range and bandwidth.
The key point is: True RMS is necessary for non-sinusoidal currents, but it is not sufficient on its own. Crest factor, peak value, measuring range, bandwidth and current sensor together determine whether the displayed current measurement is actually reliable.
Table of Contents
- What is the crest factor?
- Why does a sinusoidal current have a crest factor of 1.414?
- Why do nonlinear loads produce high crest factors?
- What does True RMS actually measure?
- Why True RMS alone does not guarantee unlimited waveform capability
- 10 A RMS is not always the same 10 A
- Consider peak value and measuring range together
- Why measurement bandwidth is crucial
- Why the current sensor also has limits
- Do not confuse crest factor with THD
- What role do harmonics play?
- Identify typical nonlinear loads
- Select the correct current measuring range
- Use the peak function and crest factor correctly
- Distinguish crest factor from inrush current
- Correctly interpret crest factor in three-phase systems
- Why nonlinear loads can also load the neutral conductor
- Consider the measurement setup and electrical safety
- Systematically diagnose typical measurement errors
- Suitable electrical measuring equipment from ICS Schneider
- Conclusion
- Frequently asked questions about crest factor and True RMS
1. What is the crest factor?
The crest factor describes the ratio between the highest absolute instantaneous value of a waveform and its RMS value.
For a current:
CF = IPeak / IRMS
The crest factor is dimensionless.
A current with 10 A RMS and a peak value of 14.14 A, for example, has:
CF = 14.14 A / 10 A = 1.414
If the peak value rises to 30 A at the same RMS current, the result is:
CF = 30 A / 10 A = 3
The RMS value is identical in both cases. However, the waveform and the stress placed on the measuring instrument by the peak value are significantly different.
This is precisely why the crest factor provides information that cannot be derived from the RMS value alone.
2. Why does a sinusoidal current have a crest factor of 1.414?
For an ideal sinusoidal AC quantity, there is a fixed relationship between peak value and RMS value.
For a sine wave:
IRMS = IPeak / √2
or:
IPeak = √2 × IRMS
The crest factor is therefore:
CF = √2 ≈ 1.414
If a measured crest factor deviates significantly from this value, the current waveform is no longer comparable with an ideal sine wave.
However, this does not automatically mean that a fault is present. A non-sinusoidal current draw can be completely normal for the connected electronic device.
| Waveform | Crest factor | Characteristics |
|---|---|---|
| Sine wave | approx. 1.414 | Classic sinusoidal AC quantity |
| Symmetrical square wave | 1.0 | Peak value and RMS value are equal |
| Triangle wave | approx. 1.732 | Peak is larger relative to RMS than with a sine wave |
| Narrow current pulse | Can be significantly higher | High peak with a comparatively low RMS value |
For industrial current measurements, the latter cases are particularly relevant, where electronic loads draw current only during short portions of a mains cycle.
3. Why do nonlinear loads produce high crest factors?
A linear electrical load has an approximately proportional current waveform that is directly determined by the applied voltage.
A conventional resistive heater supplied with a sinusoidal mains voltage therefore also draws an approximately sinusoidal current.
Many electronic loads operate differently.
A typical power supply, for example, contains a rectifier and a DC-link capacitor. The capacitor is not charged evenly throughout the entire mains cycle. Current flows mainly when the instantaneous mains voltage is high enough to recharge the DC link.
This creates short, comparatively high current pulses.
Similar effects occur, depending on the circuit and operating condition, with variable frequency drives, chargers, UPS systems, LED drivers, electronic controls and many switched-mode power supplies.
The RMS current can appear moderate even though much higher peaks occur within each mains cycle.
The narrower and higher these current pulses become, the larger the crest factor can become.
4. What does True RMS actually measure?
The RMS value describes the thermal effect of an alternating quantity.
In simplified terms, an AC current of 10 A RMS produces the same power loss in a resistive load as a DC current of 10 A.
Mathematically, the instantaneous current value is squared, averaged over the relevant period and then the square root is taken.
This allows a genuine True-RMS measuring instrument to take the actual waveform into account and means that it is not dependent on a sinusoidal current.
This distinguishes it from older or simpler average-responding instruments, which detect the average value and apply a fixed conversion factor to calculate an assumed sinusoidal RMS value.
With distorted currents, this simplified conversion can produce significantly incorrect results.
True RMS is therefore fundamentally the correct basis for modern electronic loads.
However, even a True-RMS instrument can only correctly process what its analog input, current sensor and internal sampling system are actually capable of detecting.
5. Why True RMS alone does not guarantee unlimited waveform capability
The designation True RMS describes the measurement method, but not all limits of the measuring instrument.
A real instrument has, for example, a maximum input or peak value and a limited frequency bandwidth.
If a short current peak reaches a value that the measurement path can no longer process linearly, the signal may be clipped or distorted.
The subsequent RMS calculation may then still be mathematically correct, but it is already being performed using an incompletely captured input signal.
The result can therefore be too low or otherwise incorrect.
A comparable effect occurs when significant high-frequency signal components lie outside the measurement bandwidth. These components are then not fully included in the RMS calculation.
For high-quality measuring instruments, additional specifications therefore become relevant in addition to the term True RMS:
Crest-factor capability, peak range, current measuring range, frequency bandwidth, accuracy for non-sinusoidal signals and, where applicable, additional error limits.
Only the combination of these specifications describes which waveforms can actually be measured within specification.
6. 10 A RMS is not always the same 10 A
A simple numerical example illustrates the practical significance.
Two loads each draw:
IRMS = 10 A
Load A has an approximately sinusoidal current:
CF = 1.414
This gives:
IPeak ≈ 14.1 A
Load B, by contrast, has a strongly pulsed current draw:
CF = 4
This gives:
IPeak = 40 A
From a thermal perspective, both waveforms have the same RMS value of 10 A.
For the measuring instrument, however, the second measurement is significantly more demanding. The current sensor and input electronics must briefly transfer 40 A correctly even though the display shows only 10 A RMS.
An RMS measuring range nominally above 10 A is therefore not sufficient proof that the second waveform can be captured completely.
7. Consider peak value and measuring range together
When selecting a measuring range, only the expected RMS current is often considered.
With high crest factors, the expected peak current should also be estimated.
The following relationship can be used directly:
IPeak = CF × IRMS
At 50 A RMS and a crest factor of 3, for example:
IPeak = 150 A
The clamp meter used must therefore not only be capable of displaying 50 A RMS, but must also be able to process the actual signal peak within its specified dynamic range.
Many measuring instruments therefore specify a permissible crest factor in relation to the measuring range or signal amplitude.
This specification must be considered for demanding non-sinusoidal measurements.
A “1,000 A clamp meter” therefore does not automatically mean that every arbitrary waveform with an RMS value below 1,000 A can be measured with the same accuracy.
8. Why measurement bandwidth is crucial
High current peaks often result from short pulses.
Short time-domain structures contain higher-frequency components than a pure 50 Hz fundamental waveform.
A measuring instrument with insufficient bandwidth cannot reproduce these signal components completely.
The current peaks then appear smoothed or reduced. Because the missing signal components contribute to the actual RMS energy, the calculated RMS value can also be affected.
An instrument can therefore be True RMS and still have insufficient bandwidth for a specific highly distorted waveform.
The higher the crest factor and the narrower the current pulses, the more important the frequency characteristics of the measuring instrument become.
For a general 50 Hz mains measurement, the mains frequency alone is therefore not a sufficient specification. The decisive factor is which higher-frequency components of the current waveform must also be captured.
9. Why the current sensor also has limits
With a clamp meter, the digital electronics are not the only part of the measurement chain.
The current must first be detected by the actual clamp sensor.
Different magnetic or electronic measuring principles are used depending on the instrument.
This sensor also has a limited linear operating range and defined frequency response.
Very high peaks can stress the sensor more strongly than the displayed RMS value would suggest. With an unsuitable measuring range or sensor type, this can impair signal transmission.
The same principle applies to external current transformers and sensors. Even an excellent analyzer cannot reconstruct signal components that have already been lost in the current sensor.
For power-quality measurements, the complete measurement chain must therefore always be considered:
Conductor → current sensor → measuring instrument → signal processing → displayed measured value.
10. Do not confuse crest factor with THD
Crest factor and total harmonic distortion describe different characteristics of a current waveform.
The crest factor considers only the ratio between peak value and RMS value.
It does not indicate which frequency components make up the waveform.
THD, by contrast, describes harmonic distortion and evaluates the harmonic components relative to a defined reference quantity.
| Measured quantity | What it indicates | What it does not indicate |
|---|---|---|
| RMS | Effective or thermally relevant current load | Magnitude of individual current peaks |
| Crest factor | Ratio of peak to RMS | Which harmonics produce the waveform |
| THD | Harmonic distortion | Absolute magnitude of the current by itself |
| Peak | Highest detected instantaneous value | Overall thermal effect of the waveform |
Two different waveforms can have a similar crest factor while still having different harmonic spectra.
For a comprehensive diagnosis, RMS, peak or crest factor and harmonics should therefore be considered together.
11. What role do harmonics play?
A non-sinusoidal periodic current waveform can be represented as a combination of the fundamental component and harmonics.
Short current pulses require higher harmonic frequency components for their representation.
As a result, strongly pulsed currents, increased crest factor and pronounced harmonics are often related.
However, the relationship is not sufficiently unambiguous to derive a harmonic spectrum from the crest factor alone.
Harmonic analysis is therefore often useful when diagnosing electrical network loading.
It can be used, for example, to determine whether an unusual current consists mainly of the fundamental component or whether individual harmonics make up a large proportion of the total current.
In more complex systems, a power and power-quality analyzer therefore provides significantly more information than a single RMS current reading.
12. Identify typical nonlinear loads
Nonlinear current draw is widespread in modern industrial and commercial installations.
Typical sources include variable frequency drives, servo drives, rectifiers, UPS systems, chargers, switched-mode power supplies, IT systems and electronic lighting systems.
The input stage of modern machinery can also consist of numerous individual switched-mode power supplies.
The external behavior of a load therefore does not automatically indicate sinusoidal current draw.
A motor, for example, can be operated via a variable frequency drive. On the mains side, the drive then represents a power-electronic load to the supply network even though the actual motor is a conventional electromechanical device.
When troubleshooting, it should therefore always be established which power electronics are located between the mains supply and the actual load.
13. Select the correct current measuring range
The largest possible current range is not automatically the best choice.
An unnecessarily large range can reduce the usable resolution for small RMS currents.
A measuring range that is too small, however, can be overloaded by the actual peaks even though the RMS value still appears to lie plausibly within the range.
For nonlinear loads, range selection should therefore take both quantities into account:
expected RMS current + expected peak current.
Automatic range selection also does not eliminate the need to check the instrument’s crest-factor specification. Automatic range switching can only operate within the design limits of the measurement system.
For recurring measurements on known systems, it is useful to document typical RMS, peak and crest-factor values. This makes it easier to identify later whether the current waveform has changed.
14. Use the peak function and crest factor correctly
If a measuring instrument does not calculate the crest factor directly, it can generally be determined from the peak and RMS values.
However, it must be ensured that both measured values represent the same waveform under comparable operating conditions.
A short-term peak value from an inrush event, for example, should not be divided by an RMS value from subsequent steady-state operation.
With an instrument that provides a direct crest-factor function, this correlation is handled internally according to the instrument’s measurement function.
The F407 can measure the crest factor directly and combines this quantity with TRMS, peak, power, THD and harmonic functions.
For rapid troubleshooting, this makes it possible to determine directly whether an apparently moderate RMS current actually consists of high, narrow current pulses.
15. Distinguish crest factor from inrush current
A high crest factor during normal steady-state operation must not be confused with inrush current.
The crest factor describes the shape of the current waveform within the respective evaluation period.
Inrush current, by contrast, is a time-limited transient event when a load is switched on or started.
A motor can have a high inrush current during starting and subsequently draw an approximately sinusoidal operating current.
A switched-mode power supply, by contrast, can continuously have a high crest factor during steady-state operation even though no conventional start-up event is taking place.
Different functions are therefore required for different diagnostic tasks.
A TrueInrush function analyzes the start-up event. Crest-factor and peak functions characterize the waveform at the operating point being examined.
16. Correctly interpret crest factor in three-phase systems
In a symmetrical conventional three-phase system, the three phases have similar current waveforms.
With electronic loads, however, loading and distortion can differ between the phases.
A measurement on only one phase conductor can therefore provide an incomplete picture.
During troubleshooting, the RMS currents and, where relevant, the crest factors or waveforms of all phases should be compared.
A phase with a significantly higher crest factor can, for example, indicate a different load structure or an unusual operating condition.
For complete power and power-quality analysis, simultaneous multi-phase measurement is advantageous because current waveform, voltage, power and harmonics can be correlated over time.
17. Why nonlinear loads can also load the neutral conductor
With conventional balanced linear three-phase loads, the three phase currents shifted by 120° largely cancel one another in the neutral conductor.
With nonlinear single-phase loads, this simplification is not always valid.
Certain harmonic components can add together in the neutral conductor instead of cancelling one another.
The crest factor itself does not calculate this neutral-conductor loading. However, an unusually pulsed phase current is a reason to measure the neutral current as well as the phase currents.
For system assessment, the three RMS phase values should therefore not be considered alone where numerous electronic single-phase loads are present.
A detailed harmonic analysis can then show which frequency components are responsible for the additional loading.
18. Consider the measurement setup and electrical safety
The quality of the measured value is only one aspect of instrument selection. The electrical safety of the measuring equipment used is equally important.
The measuring instrument, current clamp, test leads and accessories must be suitable for the existing voltage and measurement category at the point of use.
When measuring current with a clamp meter, only one current-carrying conductor should normally be enclosed. If both the outgoing and return conductors are enclosed together, their magnetic fields largely cancel one another and the displayed current is not the required conductor current.
The clamp jaws must close completely and must be free from dirt or foreign objects.
In confined switch cabinets, the measuring point must not be selected solely according to mechanical accessibility. Required clearances and the safety rules applicable to the installation remain decisive.
With power-quality analyzers, voltage connections and current sensors must also be clearly assigned to the correct phases. Otherwise, current values may appear plausible while power and phase calculations are incorrect.
19. Systematically diagnose typical measurement errors
| Observation | Possible cause | Recommended check |
|---|---|---|
| True-RMS instruments display different currents on the same load | Different bandwidth, crest-factor limits or current sensors | Compare technical specifications and waveform |
| RMS current appears moderate, but peak value is very high | High crest factor caused by pulsed current draw | Determine CF = Peak/RMS and check the load type |
| Measured value becomes implausible on a lower measuring range | Peak value exceeds the capability of the selected range | Select a higher range and check the peak specification |
| Clamp meter indicates less than the power-quality analyzer | Different bandwidth or sensor characteristics | Compare measurement chain and frequency range |
| High crest factor but THD is not as unusual as expected | CF and THD evaluate different waveform characteristics | Analyze waveform and harmonic spectrum separately |
| High peak occurs only during switch-on | Inrush current rather than a permanently high crest factor | Use TrueInrush or start-up recording |
| Conductor heats up more than expected based on an average-responding instrument | Non-sinusoidal current was measured too low | Repeat measurement using a suitable True-RMS instrument |
| Neutral current unexpectedly high | Nonlinear single-phase loads and harmonics | Measure neutral conductor and analyze the harmonic spectrum |
20. Suitable electrical measuring equipment from ICS Schneider
ICS Schneider Messtechnik offers True-RMS clamp meters as well as power and power-quality analyzers for measurements on linear and nonlinear electrical loads. An overview can be found under Electrical Measuring and Test Equipment, AC/DC Clamp Meters and Power and Energy Analyzers.
20.1 Chauvin Arnoux F205 Clamp Meter
The F205 is designed for maintenance, analysis and dimensioning tasks in low-voltage installations.
The instrument uses a fast digital 12-bit TRMS acquisition system and measures currents up to 600 A AC and 900 A DC.
Additional functions include power measurements, THD, TrueInrush as well as MIN, MAX and peak functions.
The F205 is therefore particularly suitable for rapid investigation of current draw, power and distortion on small and medium-sized industrial loads.
20.2 Chauvin Arnoux F407 Clamp Meter
The F407 is designed for more comprehensive measurements on electrical distribution and industrial installations.
It also uses a fast 12-bit TRMS acquisition system and measures up to 1,000 A AC and 1,500 A DC/AC+DC.
For the topic covered here, it is particularly important that the F407 can measure the crest factor directly.
Additional functions include Peak±, TrueInrush, THD-f, THD-r, harmonic analysis up to the 25th order, power and energy measurements, and data logging.
This allows RMS current, peak behavior and harmonic distortion to be investigated with the same measuring instrument.
20.3 Chauvin Arnoux F607 for Higher Currents
The F607 extends this measurement concept to higher current ranges.
It measures up to 2,000 A AC and 3,000 A DC and combines TRMS measurement with power, THD, harmonic, peak and TrueInrush functions.
With a clamping diameter of 60 mm, it is particularly suitable for larger conductors and low-voltage distribution systems.
ICS and Chauvin Arnoux explicitly emphasize the combination of high bandwidth and suitability for high crest factors when measuring different waveforms in this instrument class.
20.4 CA 8345 for Detailed Power and Signal Diagnostics
When a single clamp-meter reading is no longer sufficient, the CA 8345 provides significantly more comprehensive analysis.
The Class A power and power-quality analyzer records voltage and current quantities on multiple channels and calculates crest factors, among other parameters.
It also provides harmonics and interharmonics, trend recording, transients, TrueInrush, unbalance and numerous power and energy quantities.
This makes it possible, for example, to investigate whether an increased crest factor coincides with specific harmonics, load conditions or switching events.
For complex industrial networks, this combined analysis is significantly more informative than a single current value.
20.5 Which instrument is suitable for which task?
For a quick maintenance measurement on a single conductor, a suitable True-RMS clamp meter may be sufficient.
If high current peaks or a high crest factor also need to be assessed, an instrument with a peak function or direct CF function is useful.
For detailed diagnosis of harmonics, multiple phases, neutral-conductor loading or time-dependent power-quality problems, a power and power-quality analyzer is the better choice.
The decisive factor is not only the maximum current range, but also which waveform, bandwidth, crest-factor capability and depth of analysis are required for the application.
21. Conclusion
True RMS is a fundamental requirement for current measurements on nonlinear loads. An average-responding measuring instrument can produce significant measurement errors with strongly distorted current waveforms.
However, the designation True RMS alone does not guarantee that every arbitrary non-sinusoidal waveform within the nominal RMS measuring range will automatically be captured correctly.
The crest factor describes how high the current peak is relative to the RMS value.
A sinusoidal current has a crest factor of approximately 1.414. With strongly pulsed electronic loads, the value can be significantly higher.
As a result, an apparently low RMS current can contain very high instantaneous values.
This creates two challenges for the measuring instrument. The peak value must remain within the linear dynamic range of the current sensor and measuring electronics. At the same time, the bandwidth must be sufficient to capture the higher-frequency components relevant to the waveform.
Crest factor and THD are not the same. The crest factor describes the ratio of peak to RMS. THD describes harmonic distortion. For a complete diagnosis, RMS, peak, crest factor and harmonics should be considered together.
Inrush current must also be distinguished from a permanently high crest factor. TrueInrush examines a transient start-up event, whereas the crest factor characterizes the shape of the current waveform being examined.
For a reliable measurement, the following sequence therefore applies:
Identify the load type → use a True-RMS measuring instrument → determine the expected RMS current → consider peak value or crest factor → check measuring range and peak capability → consider the required bandwidth → select a suitable current sensor → measure THD and harmonics where necessary → evaluate the results under actual operating conditions.
The most important practical principle is therefore: Do not ask only how many amperes a measuring instrument can display. What matters is which waveform it can still measure within specification at that current level.
22. Frequently asked questions about crest factor and True RMS
22.1 What is the crest factor?
The crest factor is the ratio of the absolute peak value of a waveform to its RMS value.
22.2 What is the formula for the crest factor?
For a current, CF = IPeak / IRMS.
22.3 What crest factor does a sine wave have?
An ideal sine wave has a crest factor of √2, or approximately 1.414.
22.4 What does a crest factor of 3 mean?
The peak value is three times the RMS value. At 10 A RMS, this corresponds to a peak value of 30 A.
22.5 Is a high crest factor automatically bad?
No. It initially only indicates a pronounced peak-shaped waveform. For certain electronic loads, this can be a normal operating condition.
22.6 Why is a high crest factor difficult for the measuring instrument?
The instrument must simultaneously process a comparatively low RMS value and significantly higher instantaneous values. Strongly pulsed waveforms also frequently contain relevant higher-frequency components.
22.7 Is True RMS sufficient for every non-sinusoidal measurement?
No. Among other things, the permissible crest factor, peak range and bandwidth of the measuring instrument must also match the actual waveform.
22.8 Can a True-RMS instrument display a value that is too low?
Yes, for example if relevant peaks or higher-frequency signal components lie outside the specified capabilities of the measurement chain.
22.9 What is the difference between crest factor and peak value?
The peak value is an absolute peak current in amperes. The crest factor expresses this peak value relative to the RMS current and is dimensionless.
22.10 What is the difference between crest factor and THD?
The crest factor describes the ratio of peak to RMS. THD describes the harmonic distortion of a waveform. The two quantities provide different information.
22.11 Does a high crest factor automatically mean high THD?
Not necessarily in a clearly defined quantitative relationship. Strongly pulsed currents often contain numerous harmonics, but the harmonic spectrum cannot be determined from the crest factor alone.
22.12 Why is the bandwidth of a clamp meter important?
Short current pulses contain higher-frequency signal components. If the bandwidth is too low, these components are not fully captured and the displayed waveform or RMS value can be affected.
22.13 Is the maximum RMS current range sufficient for selecting an instrument?
No. With high crest factors, the possible peak current must also be considered.
22.14 How do I calculate the peak current from crest factor and RMS?
IPeak = CF × IRMS. At 20 A RMS and CF = 3, the peak value is 60 A.
22.15 Is crest factor the same as inrush current?
No. The crest factor characterizes the waveform within the measurement period being evaluated. Inrush current describes a time-limited transient event when a load is started.
22.16 Which loads often have non-sinusoidal currents?
Typical examples include variable frequency drives, switched-mode power supplies, chargers, UPS systems, servo drives, rectifiers and electronic lighting systems.
22.17 Can I calculate the crest factor myself using peak and RMS?
Yes, provided that the peak and RMS values describe the same operating condition and a suitable measurement period. A direct crest-factor function reduces the risk of comparing values that do not belong together.
22.18 Which ICS clamp meter measures the crest factor directly?
The Chauvin Arnoux F407 provides a direct crest-factor function and combines it with TRMS, peak, THD, harmonic, power and recording functions.
22.19 What is suitable for higher currents?
The F607 covers higher current ranges up to 2,000 A AC and 3,000 A DC and also provides comprehensive TRMS, peak, power and harmonic functions.
22.20 When is a power-quality analyzer useful?
When multiple phases, harmonics, interharmonics, neutral-conductor current, power, transients or time-dependent trends need to be investigated in addition to RMS and crest factor.
22.21 Can the CA 8345 measure crest factors?
Yes. The CA 8345 calculates crest factors for voltage and current quantities and additionally provides extensive power-quality and harmonic-analysis functions.
22.22 What information does ICS Schneider require to select a suitable measuring instrument?
Useful information includes mains voltage, AC or DC component, minimum and maximum RMS current, expected current peaks, load type, conductor diameter, required measurement category, desired harmonic or power analysis, measurement duration and whether only individual measurements or also recording and trend analyses are required.