


Controllers, process indicators and PLC inputs frequently process measured values not only for display purposes. At defined limit values, they trigger alarms, switch relays, stop machines or activate a fallback function. However, it is often difficult to determine during normal plant operation whether this response actually occurs at the correct measured value.
A stable simulator replaces the real sensor signal with a defined electrical value. This allows the input to be increased slowly and reproducibly up to the switching point. It can then be checked at which value the alarm is activated, when it resets as the value is reduced and whether the hysteresis, delay time and latching function operate correctly.
Depending on the measuring chain, 4–20 mA, 0–10 V, Pt100, thermocouple, resistance, frequency or pulse signals are simulated. The decisive factor is that the signal type, wiring and operating mode of the simulator match the input of the device under test.
This article explains how to perform limit-value tests systematically, identify typical faults and document the results in a traceable manner.
Table of contents
- Why limit values should be tested separately
- Distinguishing switching point, reset point and hysteresis
- Preparing the test safely
- Performing a limit-value test step by step
- Simulating 4–20 mA limit values
- Testing 0–10 V inputs
- Simulating Pt100 and RTD inputs
- Testing thermocouple limit values
- Testing frequency and pulse inputs
- Checking the alarm contact and downstream response
- Documenting test results
- Typical errors during limit-value testing
- Practical example: Testing the pressure alarm of a PLC input
- Which measuring instruments / products are suitable?
- Conclusion
- Frequently asked questions about limit-value simulation
Why limit values should be tested separately
A correct measured-value display does not prove that the limit-value function is also operating correctly. Several processing stages frequently lie between the input signal and the actual plant response:
- electrical input of the controller or PLC
- scaling to a physical unit
- filtering or averaging
- limit-value comparison
- hysteresis and time delay
- alarm bit or relay output
- downstream contactor, valve or shutdown function
A fault can occur at any of these points. A pressure transmitter may, for example, correctly output 16.8 mA while the PLC calculates 9 bar instead of the actual 8 bar because of incorrect scaling. Likewise, the displayed value may be correct while an incorrectly configured alarm contact switches much too late.
Real process values are frequently unsuitable for an accurate test. Pump fluctuations, temperature gradients, controller movements and plant noise make it difficult to determine the actual switching point. A simulator, on the other hand, produces stable and repeatable values.
Distinguishing switching point, reset point and hysteresis
At least two values must be determined during a limit-value test:
- Switching point: Value at which the alarm or output is activated as the signal increases or decreases
- Reset point: Value at which the output returns to its normal state as the signal is moved back
The difference between these two values is referred to as hysteresis.
Example of a high-pressure alarm:
- The alarm switches on at 8.0 bar as the pressure increases.
- The alarm resets at 7.7 bar as the pressure decreases.
- The hysteresis is 0.3 bar.
Without hysteresis, a slightly fluctuating measured value directly at the limit could cause continuous switching on and off. This behaviour is frequently referred to as chattering or cycling.
| Limit-value type | Switching behaviour | Typical application |
|---|---|---|
| Upper limit | Alarm as the measured value increases | Overpressure or overtemperature |
| Lower limit | Alarm as the measured value decreases | Minimum pressure or low level |
| Window monitoring | Alarm outside or inside a defined value range | Quality and process windows |
| Latched alarm | Remains active until acknowledged | Safety or fault indication |
An activation or reset delay may also be configured. In this case, the limit value must remain exceeded or undershot for a defined period before a response occurs.
Preparing the test safely
Simulating a process signal can trigger an actual plant response. A test value above a limit may, for example, stop a pump, close a valve or activate emergency operation.
Before starting the test, it must therefore be defined which parts of the complete functional chain are actually to be tested:
- only the measured-value display
- limit-value logic in the controller or PLC
- relay or digital output
- message in the process control system
- complete response including the actuator
Outputs that are not required may need to be safely inhibited, disconnected or placed in a designated test mode. The applicable operational release, safety and interlocking procedures must be observed.
At least the following data should be available before wiring:
- signal type and measuring range
- active or passive input circuit
- connection and terminal diagram
- limit value and hysteresis
- switching delay
- relay logic, such as normally open or normally closed
- permissible test tolerance
- expected plant response
Performing a limit-value test step by step
A reproducible test procedure should record the switching point from both directions.
1. Document the initial condition
Before making any changes, record the configuration, display, output condition and current wiring. This ensures that the condition in which the measuring point was found remains traceable.
2. Connect the simulator
The real sensor is disconnected from the input according to the specified procedure and replaced by the simulator. The signal type, polarity and, where applicable, loop power supply must be configured correctly.
3. Check plausibility values
First simulate values at the lower range value, midpoint and upper range value. This allows the input, scaling and unit to be checked for basic correctness.
4. Approach the limit value from the normal condition
Initially change the signal in larger steps until it is close to the expected switching point. Then continue in small steps or using a slow ramp.
Document the value at which the alarm bit, relay or indication actually changes state.
5. Determine the reset point
After safely exceeding the limit value, move the signal back in the opposite direction. Together with the switching point, the value at which the alarm resets provides the actual hysteresis.
6. Test the time function and repeatability
If a delay is configured, measure how long the limit value must be present. The test should be repeated several times to identify fluctuating results or non-repeatable switching behaviour.
7. Restore the original condition
After testing, correctly restore the sensor, interlocks and output releases. Finally, check that the measuring point is once again processing the actual process value.
Simulating 4–20 mA limit values
4–20 mA is frequently used for pressure, temperature, level and flow. In this case, 4 mA normally corresponds to the lower range value and 20 mA to the upper range value.
For a linear measuring range:
Current = 4 mA + 16 mA × proportion of measuring range
For a pressure range of 0 to 10 bar, for example:
| Pressure | Proportion | Current signal |
|---|---|---|
| 0 bar | 0% | 4.0 mA |
| 5 bar | 50% | 12.0 mA |
| 8 bar | 80% | 16.8 mA |
| 10 bar | 100% | 20.0 mA |
Before connection, the operating modes must be distinguished:
- Source current: The calibrator actively generates the configured current.
- Simulate transmitter: The calibrator regulates the current within an externally powered loop.
- Measure current: The calibrator is connected in series within an existing loop.
An incorrect operating mode can result in no current flowing or in two voltage sources working against each other. A suitable loop power supply must be available, particularly with passive PLC inputs.
Step functions are suitable for quick checks at 0, 25, 50, 75 and 100%. A slow ramp or manual adjustment in small increments is more suitable for determining the exact switching point.
Depending on the configuration, diagnostic values below 4 mA or above 20 mA should also be tested. This allows verification of whether the PLC correctly detects a wire fault or sensor alarm.
Testing 0–10 V inputs
With a 0–10 V input, the voltage normally corresponds directly to the percentage of the measuring range. A limit value at 70% is therefore simulated using 7.0 V.
For a correct test, the signal output and input must use the same reference potential. Potential differences between the simulator, PLC and plant can cause measurement deviations or equalising currents.
The following must also be considered:
- permissible voltage range of the input
- input impedance
- polarity
- common ground connection
- galvanic isolation
- under-range and over-range detection
For bipolar inputs such as ±10 V, the zero point, sign and limit-value logic must additionally be checked for correct configuration.
Simulating Pt100 and RTD inputs
A Pt100 input measures the electrical resistance of the sensor. A simulator provides the resistance corresponding to the required temperature according to the configured characteristic curve.
This makes it possible, for example, to check whether a temperature controller triggers an alarm at 150 °C without having to heat a real sensor and temperature process to that value.
The following must be considered before testing:
- sensor type, such as Pt100 or Pt1000
- characteristic curve or standard
- 2-, 3- or 4-wire connection
- lead-resistance compensation
- permissible measuring current of the controller input
With a 3-wire circuit, the wires must be connected according to the connection diagrams of the simulator and controller. If the terminals are bridged incorrectly, the controller may display a significantly incorrect temperature or a sensor-break fault.
In addition to the actual limit value, typical fault conditions such as an open circuit or resistance outside the measuring range should also be tested, provided that the simulator and test procedure allow this to be carried out safely.
Testing thermocouple limit values
Thermocouples provide very small temperature-dependent voltages in the millivolt range. The simulator must therefore be configured for the correct thermocouple type, such as type K, J, N or T.
The characteristic curves of different thermocouple types differ. Simulating 500 °C as type K will not produce the correct indication on a controller configured for type J.
Cold-junction compensation requires particular attention. Depending on the test setup, it may be:
- taken into account internally by the simulator
- enabled in the controller
- defined by an external reference junction
The simulator and controller must be configured so that the reference-junction temperature is taken into account correctly exactly once. Double or missing compensation causes a temperature-dependent error.
Suitable thermocouple cables and connectors prevent additional unwanted junctions. Normal copper cables may only be used if they are compatible with the intended simulation and cold-junction concept.
Testing frequency and pulse inputs
Speed, flow and counter inputs frequently operate with frequency or pulse signals. During a limit-value test, it may be simulated, for example, at which frequency an overspeed alarm or minimum-flow alarm is triggered.
In addition to the frequency, other signal characteristics must match the input:
- signal voltage and switching threshold
- square-wave, sine-wave or NAMUR signal
- open-collector or push-pull output
- duty cycle
- pulse width
- pull-up resistor
- maximum input frequency
A simulator can generate an exactly defined frequency or pulse count. This makes it possible to determine whether the input counts correctly, the scaling is correct and the limit-value logic responds at the intended value.
For a flow input, the K-factor must be taken into account. An error in the unit pulses per litre or pulses per cubic metre results in an incorrect process value and therefore an incorrect switching point despite the correct frequency.
Checking the alarm contact and downstream response
Displaying the alarm condition on the screen is only one part of the test. Depending on the task, the complete signal chain should be checked:
- limit-value symbol or LED on the instrument
- internal alarm bit
- relay contact
- digital input of the higher-level PLC
- message in the HMI or process control system
- acknowledgement and reset function
- actual shutdown or control function
For relay outputs, a distinction must be made between energised and de-energised operating principles. A contact may be energised during normal operation and drop out in the event of an alarm or power failure. The designation normally open or normally closed alone is not always sufficient without considering the operating condition.
A correctly switching relay also does not automatically prove that the signal is being processed correctly in the control system. Terminals, wiring, digital modules and software assignment may need to be tested separately.
Documenting test results
A limit-value test should be documented in such a way that it can be reproduced and evaluated later.
| Test characteristic | Example |
|---|---|
| Measuring point | Pressure alarm P-102 |
| Signal and measuring range | 4–20 mA = 0–10 bar |
| Specified switching point | 8.0 bar |
| Actual switching point, increasing | 8.02 bar |
| Actual reset point | 7.71 bar |
| Actual hysteresis | 0.31 bar |
| Delay | 2.1 seconds |
| Response | Alarm bit and relay correct |
The test instrument used, serial number, calibration status, date, tester, ambient conditions and any adjustments made should also be recorded.
The condition as found should be documented as “As Found”. If a setting is subsequently changed, a second test is performed in the final condition and documented as “As Left”.
A functional test of the switching point alone is not automatically a complete calibration of the entire measuring chain. For traceable calibration, the test equipment, measurement uncertainty and procedure must be defined accordingly.
Typical errors during limit-value testing
| Error | Possible consequence | Better approach |
|---|---|---|
| Only the activation point is tested | Incorrect hysteresis remains undetected | Record the switching and reset points |
| Signal is changed too quickly | Switching point and delay cannot be distinguished | Use a slow ramp or small increments |
| Incorrect source or simulation mode for 4–20 mA | No signal or incorrect electrical connection | Clarify active and passive loop configuration beforehand |
| Incorrect Pt100 wire connection | Temperature deviation or sensor fault | Observe the 2-, 3- or 4-wire circuit diagram |
| Incorrect thermocouple type | Systematic temperature deviation | Configure the simulator and input identically |
| Only the display message is checked | A fault in the relay or PLC signal path remains undetected | Test the complete functional chain |
| Actuator is triggered unintentionally | Plant shutdown or hazardous situation | Define the test scope and output inhibitions beforehand |
| No final test after adjustment | A new fault remains undetected | Repeat the complete As-Left test |
Practical example: Testing the pressure alarm of a PLC input
A pressure transmitter has a measuring range of 0 to 10 bar and provides a 4–20 mA output. An upper alarm is configured in the PLC at 8.0 bar with a hysteresis of 0.3 bar and an activation delay of two seconds.
Following operational approval, the real transmitter is disconnected from the PLC input. A loop calibrator is connected in the appropriate operating mode.
First, 4.0 mA, 12.0 mA and 20.0 mA are simulated. The PLC displays 0.0 bar, 5.0 bar and 10.0 bar respectively. The scaling and input therefore appear plausible.
The expected upper switching point of 8.0 bar corresponds to:
4 mA + 16 mA × 0.8 = 16.8 mA
The signal is initially set to 16.5 mA and then increased slowly. At 16.83 mA, the PLC displays 8.02 bar. After approximately two seconds, the alarm bit is set and the corresponding relay switches.
The current is then reduced slowly. The alarm resets at 16.34 mA, corresponding to approximately 7.71 bar. The determined hysteresis is therefore approximately 0.31 bar and is within the defined tolerance.
The test is repeated three times. The switching point, reset point and delay remain repeatable. Finally, the transmitter is reconnected and the actual process value is checked.
The example shows that a stable simulated signal can be used to test not only the scaling but also the limit value, hysteresis, delay, alarm bit and relay output.
Which measuring instruments / products are suitable?
The simulators category contains instruments for the targeted simulation of current, voltage, resistance, temperature, frequency and other sensor signals.
Multifunctional instruments for measuring, simulating, loop powering and documenting test procedures can be found under process calibrators and electrical calibrators.
UPS4E for 4–20 mA limit-value testing
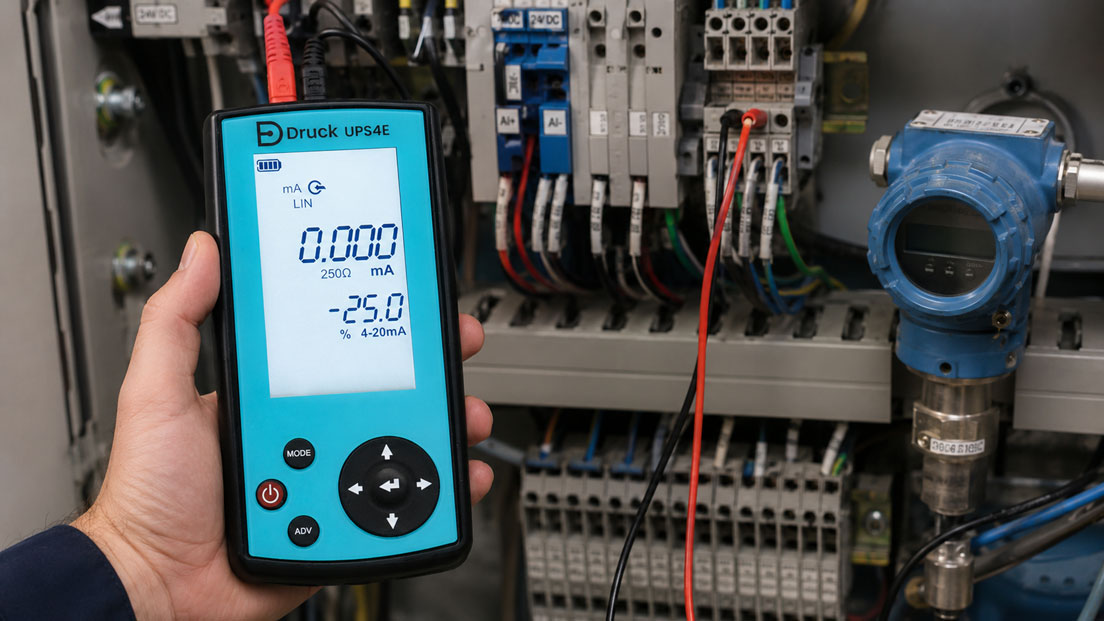
The UPS4E loop calibrator is particularly suitable for switching-point tests on PLC analogue inputs, process indicators, controllers and actuators with 4–20 mA signals.
It can measure and source current, power passive loops and automatically or manually approach defined test points using step, span and ramp functions.
To determine a limit value accurately, the signal can be moved slowly across the expected switching point. The simultaneous display of mA and percentage simplifies tests on linearly scaled measuring ranges.
ICS 02S for Pt100, RTD and thermocouple inputs
The ICS 02S simulator for Pt100, RTD, TC and mV/V is suitable for testing temperature controllers, transmitters and PLC temperature modules.
It can measure or simulate resistance-thermometer and thermocouple signals. Temperature limits can therefore be approached without a real furnace, temperature bath or connected process sensor.
DPI620 Genii for multifunctional test applications
The DPI620 Genii pressure calibrator and process calibrator combines electrical, temperature, frequency and optional pressure-related test functions in a modular system.
It is particularly suitable when different input signals need to be tested on a plant, measured values recorded simultaneously or more extensive calibration procedures documented.
CPH8000 for mixed signals, frequencies and pulses
The WIKA CPH8000 portable multifunction calibrator supports the measurement and simulation of electrical signals, RTDs, thermocouples, frequencies and pulses as well as pressure, depending on the configuration.
In addition to analogue limit values, this allows speed, flow and counter inputs to be tested using defined frequencies or pulse sequences.
ICS Schneider Messtechnik assists with selecting the simulator, defining the test setup and creating application-specific test points. The required information includes the signal type, measuring range, input circuit, limit value, hysteresis, delay, required test scope and any hazardous-area requirements.
Conclusion: A stable simulated signal makes switching points reproducibly testable
Limit-value functions should not be assessed solely using fluctuating real process values. A simulator allows the input to be moved in a controlled manner up to the switching point and then back again.
A complete test records not only the activation value but also the reset point, hysteresis, delay, latching function and downstream response of the relay, PLC and control system.
For 4–20 mA signals, a loop calibrator such as the UPS4E is particularly practical. Temperature controllers with Pt100, RTD or thermocouple inputs can be tested using the ICS 02S. Multifunctional process calibrators additionally cover voltage, resistance, frequency, pulses and, where applicable, pressure.
Before each test, it must be clarified whether real actuators may be triggered. The test setup must neither cause unintended plant movement nor impermissibly bypass protective functions.
A documented comparison of the specified value, actual switching point, reset point and response time provides a reliable basis for commissioning, maintenance and recurring functional tests.
Frequently asked questions about limit-value simulation
Why must the limit value be tested from both directions?
Only this makes it possible to determine the switching point, reset point and actual hysteresis.
Is a limit-value test the same as calibration?
Not automatically. A limit-value test initially confirms the function. For traceable calibration, the procedure, test equipment and measurement uncertainty must additionally be defined.
How accurately should the simulator be set?
Its uncertainty should be sufficiently smaller than the permissible tolerance of the switching point being tested. The specific requirement depends on the process and test specification.
Should the signal be changed in steps or as a ramp?
Steps are suitable for quick functional checks. A slow ramp or small manual increments allow the switching point to be determined more accurately.
Can a UPS4E test a passive PLC input?
Yes, provided that the correct source or loop-power mode and wiring suitable for the input circuit are used.
How is a Pt100 limit value simulated?
The simulator generates the resistance corresponding to the required temperature for the selected characteristic curve. The connection must match the 2-, 3- or 4-wire circuit.
Why does a thermocouple controller display an incorrect value despite the correct temperature being simulated?
Possible causes include an incorrectly selected thermocouple type, incorrect cold-junction compensation or unsuitable connecting cables.
How is a switching delay tested?
The simulated value is set above the limit and held stable. The time until the actual alarm response is then measured.
Must the output relay also be tested?
Yes, if the complete limit-value function is to be assessed. The display, internal alarm bit and physical output can fail independently of one another.
Which information does ICS Schneider require for selecting the instrument?
The required information includes the signal type, measuring range, active or passive input circuit, limit values to be tested, required accuracy, temperature or frequency types, documentation requirements and possible hazardous areas.