


Many technical problems cannot be explained by a single measured variable. Excessive temperature in a control cabinet may be related to the load situation. Moisture damage often only occurs through the interaction of temperature, relative humidity and dew point. Pressure fluctuations in a system can depend on temperature changes, valve switching operations or changing operating states. Anyone who looks at only one value often sees only part of the problem.
Multi-measurement data loggers are therefore particularly valuable when several measured variables need to be recorded simultaneously and later evaluated together. Instead of measuring temperature, humidity, pressure, voltage, current or other signals one after another, the values are recorded in a time-synchronized way. This makes it possible to identify relationships that are easily overlooked with individual measurements.
This article explains when a multi-measurement data logger is useful and what should be considered when selecting one. The focus is on multiple channels, combined root cause analysis, process monitoring, energy analysis, climate monitoring, control cabinet diagnostics, long-term measurement, synchronization of measured values, evaluation, alarm limits, measuring intervals and suitable products such as multi-measurement devices used as data loggers as well as the testo 176P1 for pressure, temperature and humidity.
Table of contents
- Basics: what is a multi-measurement data logger?
- Why several measured variables often say more than a single value
- Typical measured variables: temperature, humidity, pressure, voltage and current
- Selecting channels, probes and input signals correctly
- Synchronization: why a shared time reference is decisive
- Long-term measurement: detecting trends instead of snapshots
- Climate monitoring: evaluating temperature, humidity and pressure together
- Process monitoring and technical root cause analysis
- Energy analysis, load condition and electrical measured variables
- Control cabinet diagnostics: considering heat, voltage and load together
- Evaluation, software, export and documentation
- Typical errors with multi-measurement data loggers
- Practical example: humidity problem in a technical room
- Which measuring instruments / products are suitable?
- Conclusion: multi-measurement data loggers make relationships visible
- FAQ: frequently asked questions about multi-measurement data loggers
Basics: what is a multi-measurement data logger?
A multi-measurement data logger is a measuring instrument that automatically records several measured variables or several measuring channels over a defined period of time. Depending on the device, temperature, humidity, pressure, voltage, current, frequency, pulses, digital states or sensor signals can be recorded. The measured values are stored with a time stamp and then evaluated as a table, diagram or report.
The difference compared with a simple single data logger is not only the number of channels. The decisive point is that different measured variables can be considered together. This creates a time relationship: what happens first? Which measured variable changes at the same time? Which condition only occurs when another process state is reached?
In practice, such relationships are often more important than absolute individual values. A temperature of 45 °C may be uncritical or critical, depending on whether it occurs briefly or permanently, whether humidity rises at the same time, whether an electrical load is active or whether a control cabinet fan fails. A multi-measurement data logger provides the data basis for this.
Typical areas of application include process monitoring, building technology, climate-controlled storage, laboratories, quality assurance, hydraulics, compressed air, control cabinet diagnostics, energy analysis, test bench technology, complaint handling and maintenance. Wherever a fault is not immediately visible or only occurs sporadically, simultaneous recording of several variables can be decisive.
| Feature | Meaning with a multi-measurement data logger | Practical benefit |
|---|---|---|
| Several channels | Several measuring points or measured variables are recorded simultaneously | Relationships between cause and effect become visible. |
| Time stamp | Each measured value is assigned to a specific time | Events can be traced later. |
| Long-term memory | Data is recorded over hours, days or weeks | Sporadic faults and trends become recognizable. |
| Evaluation | Measured values can be analyzed graphically or in table form | Reports, evidence and root cause analyses become easier. |
| Flexible inputs | Depending on the device, probes, current, voltage or frequency inputs are possible | One device can cover different measuring tasks. |
Why several measured variables often say more than a single value
A single measured value only describes one state. However, it often does not explain why this state occurred. This is exactly where the greatest benefit of a multi-measurement data logger lies: it connects several measured variables and makes dependencies visible.
One example is climate monitoring. Increased relative humidity alone is not yet a complete explanation. Only in combination with temperature can it be assessed whether condensation can occur, whether a room cools down too much or whether there is a ventilation problem. If air pressure or a door contact is also recorded, it becomes even easier to determine whether the problem is caused by outside air, ventilation cycles or operating states.
Faults in technical systems also often arise from combinations. A pressure drop may coincide with a temperature rise, a pump switching operation, a valve position or a voltage change. If these variables are not recorded simultaneously, the analysis remains incomplete.
In complaints, maintenance and quality assurance, synchronized data recording is particularly helpful. It replaces assumptions with measured data. Instead of merely saying that a problem occurs “occasionally”, it can be shown when it occurs, how long it lasts and which other measured variables change at the same time.
Typical measured variables: temperature, humidity, pressure, voltage and current
Which measured variables are relevant depends strongly on the application. In climate and storage monitoring, temperature and humidity are the main focus. In laboratories, cleanrooms or test environments, pressure may also be important. In technical systems, voltage, current, frequency, pulses, pressure, temperature or switching states are added.
Temperature is one of the most common measured variables. It influences material behavior, humidity, electronics, process stability, lubricants, batteries, storage conditions and energy demand. Humidity is particularly critical wherever condensation, corrosion, mold, material changes or product damage can occur.
Pressure is relevant in laboratories, process plants, compressed air systems, cleanrooms, ventilation systems, hydraulics, test benches and leak tests. Electrical variables such as voltage and current help identify load states, energy consumption, start-up processes, failures or unstable supplies.
The real added value arises when these variables are not considered in isolation. Temperature plus humidity indicates condensation risks. Pressure plus temperature helps with process and leakage assessment. Voltage plus current shows load behavior. Temperature plus current can make overload or insufficient cooling visible.
| Measured variable | Typical use | Interesting combination |
|---|---|---|
| Temperature | Climate, storage, process, control cabinet, test bench | Temperature + humidity, temperature + current, temperature + pressure |
| Relative humidity | Storage, buildings, laboratory, transport, production | Humidity + temperature for evaluating dew point and condensation |
| Pressure | Laboratory, process, cleanroom, compressed air, hydraulics | Pressure + temperature or pressure + switching state |
| Voltage | Supply, battery, control system, electrical system | Voltage + load state or voltage + temperature |
| Current | Energy analysis, motors, consumers, control cabinet | Current + temperature for detecting overload |
Selecting channels, probes and input signals correctly
The number of channels of a multi-measurement data logger should match the measuring task. It is not enough to have as many channels as possible. What matters is which channels are actually needed, which accuracy is required and which sensors are to be connected. A device with five suitable channels can be better for an application than a device with many inputs but the wrong signal type.
For temperature measurements, it must be clarified whether internal probes, external probes, Pt100, thermocouples or other sensor types are required. For humidity, it is important whether the probe must respond quickly, whether it should be mounted remotely and which operating conditions apply. For pressure, it must be checked whether absolute pressure, gauge pressure or differential pressure is to be measured.
For electrical measured variables, input type and safety are decisive. Voltage, current, frequency or pulses must be within the permissible range of the data logger. With higher voltages, current transformers, current clamps or industrial signals, the connection method must be designed correctly. With 4–20 mA signals, supply, load and scaling must also be considered.
Good preparation saves a lot of effort later. Before selection, it should be clear which measured variables are to be recorded at which measuring points, how long the measurement should last, which resolution is required and how the data is to be evaluated.
Synchronization: why a shared time reference is decisive
The most important advantage of a multi-measurement data logger is the shared time base. When temperature, humidity, pressure and voltage are recorded with the same logger or with cleanly synchronized devices, events can be compared precisely. This makes it visible which change occurs first and which measured variable follows.
This is more difficult with separate individual measurements. If several devices have different clocks, different measuring intervals or uncoordinated start times, the evaluation can become uncertain. Even a deviation of a few minutes can be decisive if a fault occurs only briefly.
A shared time stamp is particularly important for sporadic faults. Example: a control cabinet only occasionally shows failures. If temperature, supply voltage and load current are logged simultaneously, it can be checked whether a voltage dip, overtemperature or load change precedes the failure.
For professional measurements, the start time should therefore be clearly documented. Measuring interval, time zone, device clock, measuring point designation and channel assignment should also be clear. Only then can data be interpreted properly later.
| Synchronization point | Why important? | Typical consequence of errors |
|---|---|---|
| Shared start time | All channels start at the same time | Events can be clearly compared. |
| Uniform measuring interval | Measured values are available in the same time grid | Trends and correlations become easier to see. |
| Correct device clock | Time stamps match real events | Faults can be compared with system events. |
| Clear channel designation | Measuring points can be clearly assigned later | Confusion during evaluation is avoided. |
| Documented measuring setup | Sensor position and connection are traceable | The measurement report becomes more reliable. |
Long-term measurement: detecting trends instead of snapshots
Many technical problems are not visible during a short measurement. A system may work normally during inspection, but show problems at night, at weekends, during load changes or during weather changes. Long-term measurements help detect such time-dependent effects.
A multi-measurement data logger can record over hours, days or weeks. This makes trends, limit violations, recurring patterns and rare events visible. This is often decisive, especially in complaints or faults that are difficult to trace.
The measuring interval must match the application. Longer intervals are often sufficient for slow climate trends. Shorter intervals are necessary for switching operations, pressure surges or electrical events. An interval that is too long can miss short events. An interval that is too short creates large data volumes and can make evaluation more difficult.
Memory size and battery life are also important. A long measuring duration is of little use if the memory fills up too early or the battery fails. For professional measurements, it should therefore be checked in advance whether measuring duration, interval, number of channels and memory fit together.
Climate monitoring: evaluating temperature, humidity and pressure together
In climate, storage and laboratory applications, temperature and humidity are often closely linked. A relative humidity of 70% must be evaluated differently at low temperature than at high temperature. Only the combined view shows whether condensation, corrosion, material changes or product damage are likely.
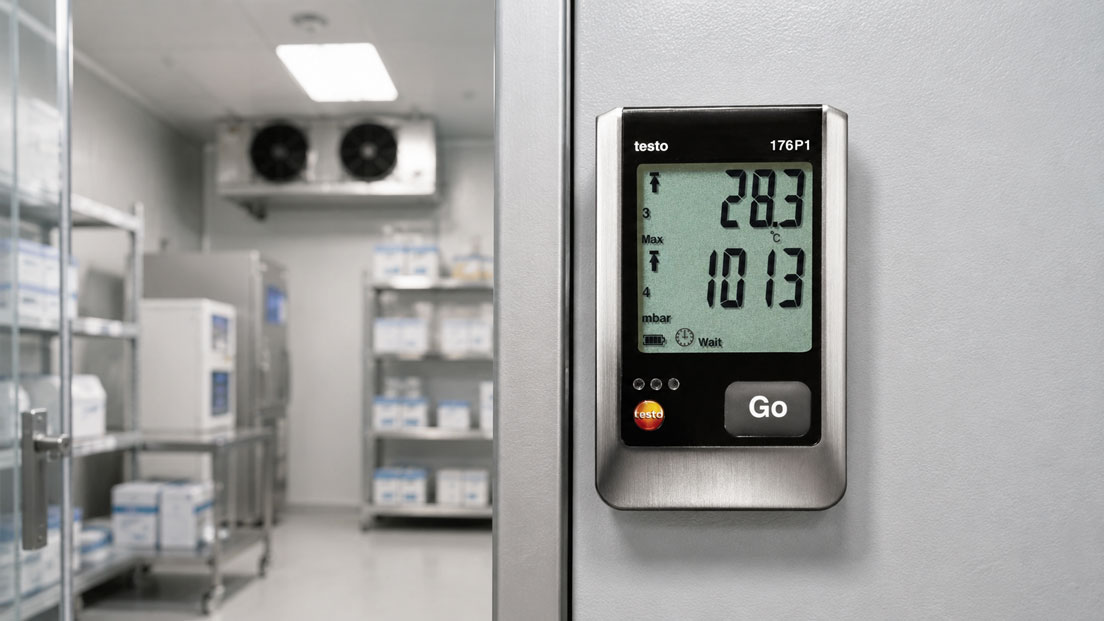
The testo 176P1 is a typical example of a data logger that can combine pressure, temperature and humidity in one measuring task. The integrated absolute pressure sensor is particularly interesting when environmental conditions in laboratories, technical rooms or climate-sensitive areas need to be documented. With additional temperature/humidity probes, several values can be recorded at the same time.
In building and storage technology, such measurements can help find the causes of moisture damage or climate problems. If humidity values always rise when the temperature drops or a door is opened, the cause can be narrowed down more easily. If pressure fluctuations coincide with ventilation times, this may indicate a ventilation or building concept issue.
Documentation is also important for sensitive products, archives, laboratories or test rooms. Measurement data can show whether limits were maintained, when deviations occurred and whether corrective measures were effective.
| Application | Useful measured variables | Benefit of combined evaluation |
|---|---|---|
| Storage room | Temperature, humidity | Assessment of climate stability and humidity risk. |
| Laboratory | Pressure, temperature, humidity | Proof of stable environmental conditions. |
| Technical room | Temperature, humidity, operating state | Detection of ventilation or condensation problems. |
| Transport | Temperature, humidity, events | Documentation of transport conditions and limit violations. |
| Cleanroom / controlled area | Pressure, temperature, humidity | Monitoring of environmental conditions and differential pressure concept. |
Process monitoring and technical root cause analysis
In technical processes, deviations rarely occur in isolation. A pressure drop can be caused by a temperature change, a valve switching operation, a pump, a leak or a changed load condition. A multi-measurement data logger helps identify these relationships.
In compressed air systems, for example, the pressure profile can be considered together with compressor running times or electrical load. This makes it possible to determine whether a pressure drop is caused by increased consumption, leakage or control behavior. In hydraulic systems, pressure, temperature and electrical control can be recorded together in order to assess valves or pumps more effectively.
In test benches, synchronous recording of several variables is particularly important. A test result is often meaningful only when framework conditions such as temperature, pressure, voltage, current or ambient climate are documented. Without this additional data, measured values can be difficult to compare later.
The combination is also decisive for sporadic faults. If a fault occurs only once per day or only under certain operating conditions, a data logger can record continuously and capture the decisive minutes.
Energy analysis, load condition and electrical measured variables
Electrical measured variables such as voltage, current and power are particularly important for energy analysis, system monitoring and troubleshooting. When electrical loads are recorded together with temperature, pressure or operating states, the causes of overload, voltage drops or unusual energy consumption can be identified more easily.
A current or voltage profile alone shows when a consumer was active. Only in connection with process values does it become clear whether this consumer achieved the desired effect. Example: a fan draws current, but the control cabinet temperature does not drop. In that case, there may be an airflow, filter or cooling problem.
The combination is also helpful with motors, pumps or compressors. If the current rises while the pressure does not increase accordingly, this may indicate mechanical problems, leaks or inefficient operating conditions. If the supply voltage drops during load peaks, this may be the cause of control problems.
For such tasks, data loggers for current and voltage or multi-measurement devices with suitable inputs are relevant. It is important that measuring range, safety category, current transformer, connection type and sampling rate match the task. Electrical measurements may only be carried out with suitable instruments and by qualified personnel.
Control cabinet diagnostics: considering heat, voltage and load together
Control cabinets are a good example of why multi-measurement data loggers are useful. Increased temperature can be caused by high ambient temperature, dirty filters, defective fans, high load, poor airflow or sunlight. Without further measured variables, the cause often remains unclear.
When temperature inside the control cabinet, ambient temperature, current consumption of important consumers and supply voltage are recorded together, a much clearer picture emerges. It becomes clear whether the temperature is related to load peaks, whether it drops at night, whether a fan switches regularly or whether voltage drops occur with certain operating states.
Humidity can also be relevant in control cabinets. Condensation often does not occur at the highest temperature, but during unfavorable temperature changes. If humidity and temperature are recorded together, the risk can be assessed more effectively.
For maintenance, such measurements are valuable because they not only show the fault, but also help narrow down the cause. This allows measures to be planned more precisely, such as filter replacement, fan inspection, air conditioning, load distribution or changing the installation location.
| Fault pattern in the control cabinet | Useful measured variables | Possible finding |
|---|---|---|
| Overtemperature | Internal and external temperature, load current | Relationship between load and heating. |
| Voltage drop | Supply voltage, current, switching state | Effect of starting currents or power supply problems. |
| Condensation | Temperature, humidity, door opening | Risk due to temperature changes or ambient air. |
| Fan problem | Temperature, current consumption, switching time | Fan is running but not effective enough. |
| Sporadic control fault | Voltage, temperature, operating state | Comparison between failure time and environmental/load data. |
Evaluation, software, export and documentation
The quality of a multi-measurement does not depend only on the device, but also on the evaluation. Measurement data must be presented in such a way that relationships become visible. Diagrams with several curves, table exports, limit markings and event logs help interpret the data correctly.
Channel naming is an important point. If channels are later only called “CH1”, “CH2” or “Input 3”, the evaluation becomes prone to errors. Clear designations such as “control cabinet internal temperature”, “24 V DC supply”, “technical room humidity” or “pressure line A” are better.
Units and scaling must also be correct. With 4–20 mA signals, it must be clear which measuring range corresponds to 4 mA and 20 mA. With voltage inputs, it must be checked whether a direct voltage value or a sensor signal is being recorded. Incorrect scaling can lead to results that appear plausible but are technically wrong.
The UPS4E loop calibrator can be helpful for checking analog 4–20 mA signals. It can be used to measure or simulate current loops and detect scaling errors between sensor, data logger, display, PLC and control system. Especially with combined measuring chains, this is an important step before or during troubleshooting.
Typical errors with multi-measurement data loggers
A common error is selecting a data logger based solely on the number of channels. Many channels are of little use if the inputs do not match the sensors or if the accuracy is insufficient. The measuring task must be defined first; only then should the device be selected.
Another error is an unsuitable measuring interval. If the interval is too long, short events are missed. If it is too short, large amounts of data are generated that are difficult to evaluate. The correct interval depends on how quickly the measured variable can change.
Sensor positions are also often underestimated. A temperature probe near a heat source measures something different from a probe in free space. A humidity probe directly on a cold wall can show different values than a probe in the middle of the room. A pressure sensor at an unfavorable point can capture local effects instead of the relevant process state.
Unclear documentation of the measuring setup is also problematic. If it is later no longer known which sensor was installed where, the measurement loses significance. Measuring points, channel assignment, start time, measuring interval and special events should therefore be documented.
| Error pattern | Possible cause | Test approach |
|---|---|---|
| Relationship is not recognizable | Measured variables were not recorded synchronously | Check shared time base and measuring interval. |
| Short events are missing | Measuring interval too long | Adapt sampling rate to the dynamics of the measured variable. |
| Measured values appear plausible but are wrong | Incorrect scaling or unit | Check sensor range, input signal and software parameters. |
| Measurement data is difficult to evaluate | Channels not named or measuring points not documented | Document channel names and measuring setup clearly. |
| Measurement ends too early | Memory or battery is insufficient | Check measuring duration, interval, number of channels and battery status in advance. |
Practical example: humidity problem in a technical room
In a technical room, traces of corrosion repeatedly appear on electrical components. During a short inspection, the room climate seems unremarkable. Temperature and humidity are within the normal range. Nevertheless, employees repeatedly report moisture forming on metal surfaces, especially in the morning after cool nights.
A multi-measurement data logger is used for root cause analysis. It records temperature and relative humidity in the room, as well as a second temperature measuring point on a cold external wall and the operating state of the ventilation. The measurement runs over several days so that night and weekend conditions are also recorded.
The evaluation shows that the room temperature drops at night and the relative humidity rises at the same time. At the cold wall, a critical condition is temporarily reached, while the room air in the middle of the room still appears unremarkable. It is also clear that ventilation does not work sufficiently during certain time windows.
Without simultaneous recording of several measured variables, the cause would have been difficult to identify. Only the combination of temperature, humidity, wall temperature and ventilation state shows why the problem occurs only at certain times. On this basis, ventilation times, insulation or room climate control can be adjusted in a targeted way.
Which measuring instruments / products are suitable?
The category multi-measurement devices as data loggers is the right starting point when several measured variables or industrial sensor signals need to be recorded together. Such devices are particularly interesting for maintenance, test benches, mobile diagnostics, process analysis and technical evidence.
The testo 176P1 data logger for pressure, temperature and humidity is particularly suitable for applications where environmental conditions need to be documented reliably. It combines absolute pressure measurement with connectable temperature/humidity probes and is therefore interesting for laboratories, climate monitoring, technical rooms or quality-relevant environments.
The higher-level category data loggers / universal measuring instruments provides a broad overview of data loggers for temperature, humidity, pressure, current, voltage and multi-measurement tasks. It is useful when it first needs to be clarified whether a special logger or a universal multi-channel device is better suited to the task.
For long-term electrical measurements, the category current and voltage data loggers is relevant. It is particularly interesting for energy analysis, load profiles, voltage drops, grid monitoring or control cabinet diagnostics.
If analog current loops are included in a multi-measurement, the UPS4E loop calibrator can also be helpful. It can be used to check and simulate 4–20 mA signals and compare them with the scaling in the data logger or PLC.
| Product / area | Typical use | Particularly relevant for |
|---|---|---|
| Multi-measurement devices as data loggers | Multi-channel recording of different measured variables | Root cause analysis, test benches, mobile diagnostics, process monitoring |
| testo 176P1 | Data logger for pressure, temperature and humidity | Laboratory, climate monitoring, technical rooms, quality-relevant environments |
| Data loggers / universal measuring instruments | Overview of different data logger categories | Selection between temperature, humidity, pressure, current/voltage and multi-measurement loggers |
| Current and voltage data loggers | Recording electrical variables | Energy analysis, voltage drops, load profiles and control cabinet diagnostics |
| UPS4E loop calibrator | Testing and simulation of 4–20 mA signals | Scaling check, signal comparison and troubleshooting in analog measuring chains |
Conclusion: multi-measurement data loggers make relationships visible
Multi-measurement data loggers are useful whenever a technical problem cannot be explained by a single measured variable. They record several values simultaneously and thereby make temporal relationships visible. This is particularly helpful for climate monitoring, process analysis, energy analysis, control cabinet diagnostics, long-term measurement and technical troubleshooting.
Correct selection is decisive. Measured variables, number of channels, sensors, input signals, measuring interval, memory, battery, software and documentation must match the task. A data logger is only as good as the measuring setup, the sensor position and the later evaluation.
The most important recommendation is: before the measurement, define precisely which cause is suspected and which measured variables can make this relationship visible. Then temperature, humidity, pressure, voltage, current or other signals can be recorded in a targeted way and evaluated together. This turns a pure data collection into a reliable technical analysis.
FAQ: frequently asked questions about multi-measurement data loggers
What is a multi-measurement data logger?
A multi-measurement data logger is a device that automatically records several measured variables or several measuring channels over a period of time and makes them available for later evaluation.
When is a multi-measurement data logger useful?
It is useful when a problem may be caused by several influencing variables, for example temperature and humidity, pressure and temperature or voltage and load condition.
Which measured variables can be recorded together?
Depending on the device, temperature, humidity, pressure, voltage, current, frequency, pulses, digital states or sensor signals can be recorded.
Why is a single data logger often not enough?
A single value shows only part of the situation. Many faults result from relationships between several measured variables that only become visible through synchronous recording.
What does synchronous measured value recording mean?
Synchronous recording means that all measured variables are recorded with the same time base. This allows events to be compared in time.
How do you select the correct measuring interval?
The measuring interval depends on the dynamics of the measured variable. Slow climate trends require longer intervals, while fast switching or pressure events require shorter intervals.
Why is temperature important together with humidity?
Relative humidity strongly depends on temperature. Only both values together allow meaningful evaluation of condensation, dew point or moisture damage.
When is pressure relevant in addition to temperature and humidity?
Pressure is relevant in laboratories, cleanrooms, ventilation systems, process plants or environments where stable environmental conditions must be documented.
What is the advantage of the testo 176P1?
The testo 176P1 combines pressure measurement with connectable temperature/humidity probes and is therefore suitable for environmental monitoring, laboratories, technical rooms and quality-relevant areas.
What role do current and voltage play in multi-measurements?
Current and voltage show load states, supply drops or energy consumption. In combination with temperature or process variables, causes can be identified more easily.
Can 4–20 mA signals be recorded with data loggers?
Yes, if the data logger has suitable inputs or a suitable signal module is used. Correct supply, load and scaling are important.
How do you check whether a 4–20 mA signal is scaled correctly?
A loop calibrator can be used to measure or simulate the signal. This makes it possible to check whether sensor, data logger, display or PLC use the same measuring range.
Why is sensor position so important?
The sensor position strongly influences the measured value. A probe on a wall measures different conditions than a probe in the middle of a room or directly near a heat source.
How long should a long-term measurement last?
The measuring duration depends on the problem. For climate and building topics, several days are often useful; for sporadic faults, longer may be necessary. The decisive point is that typical operating states are recorded.
What must be documented before a measurement?
Important points include measuring points, channel designation, sensor position, start time, measuring interval, devices used, calibration status and special operating states.
How are data logger values evaluated?
Typical methods include diagrams, tables, Excel export, limit evaluation and reports. The decisive point is that several curves can be considered together over time.
When is a multi-measurement device better than several individual devices?
A multi-measurement device is better when measured values need to be compared synchronously and a shared evaluation is important. Individual devices can be useful when measuring points are far apart.
Which errors often occur with multi-measurement data loggers?
Typical errors include incorrect measuring interval, unsuitable sensor position, incorrect scaling, unclear channel names, insufficient battery life or missing documentation of the measuring setup.
Which products are suitable for several measured variables?
Suitable products include multi-measurement devices used as data loggers, special pressure/temperature/humidity data loggers such as the testo 176P1, as well as current and voltage data loggers for long-term electrical measurements.
What is the most important rule for multi-measurements?
The measurement should always be planned based on the specific question. Only when it is clear which relationship is to be checked can the suitable measured variables, sensors and intervals be selected.