


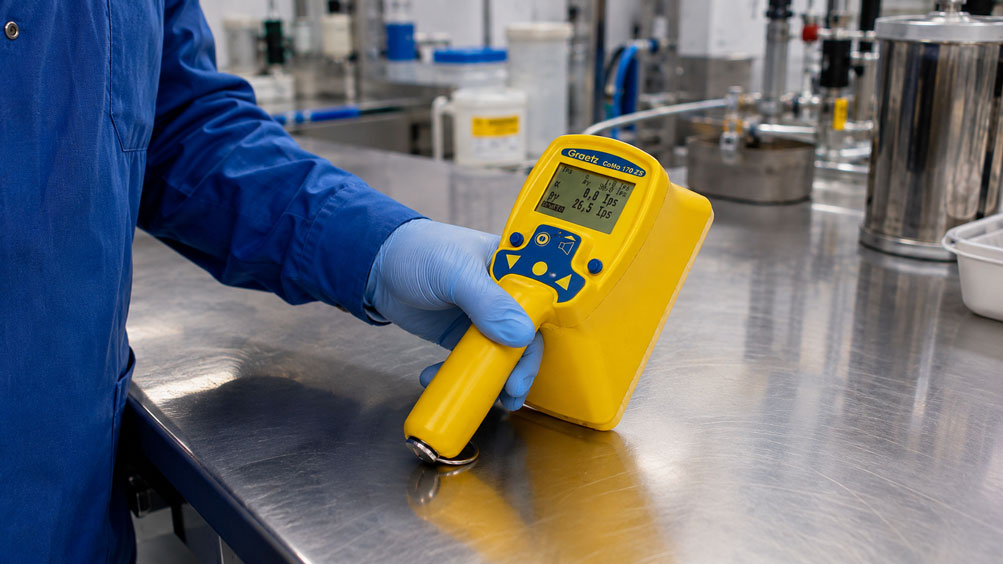
A contamination monitor initially shows 18 Ip/s on a surface, a few seconds later 23 Ip/s and during another measurement 20 Ip/s. Has the contamination actually changed, or is only the number of registered counts fluctuating?
Such fluctuations are fundamentally to be expected when measuring ionizing radiation. Radioactive decays occur randomly. Even with a completely unchanged source, identical measuring distance and constant background, exactly the same number of counts will normally not be registered during two equally long measuring intervals.
The fewer counts registered during a measuring interval, the greater the statistical fluctuation relative to the measured value. Especially with low levels of contamination close to the natural or instrument-related background, a very short measuring time can therefore lead to considerably fluctuating results.
When evaluating a contamination measurement, it is therefore not sufficient to consider only the displayed count rate. Counting time, background, number of registered counts, measuring geometry and the required detection confidence must all be considered together.
Why do count numbers fluctuate at all?
A radiation detector registers individual interaction events. Radioactive decays, however, do not occur at regular time intervals. Even with constant activity, for example, 190 counts may be registered within ten seconds during one measurement and 207 counts during a repeat measurement.
Such a deviation does not initially mean that the activity has changed. It is part of the statistical nature of radioactive decay and count detection.
For many practical measuring situations, the number of registered events can be approximated using a Poisson distribution. This results in a particularly important relationship: the statistical standard deviation of a counted number of events N is approximately:
σ ≈ √N
The relative statistical standard deviation is therefore approximately:
σrel ≈ 1 / √N
The practical consequence is straightforward: the more counts that are registered, the smaller the statistical uncertainty becomes relative to the measurement result.
Distinguishing count number and count rate
In a contamination measurement, either the counts registered during a time interval or the count rate calculated from them can be considered.
The count rate is calculated in simplified form as:
R = N / t
Where:
R= count rate, for example in Ip/s,N= registered counts,t= counting time in seconds.
If a total of 200 counts are registered within 10 seconds, the result is:
R = 200 / 10 s = 20 Ip/s
If 1,200 counts are registered during 60 seconds, the count rate is also:
R = 1,200 / 60 s = 20 Ip/s
Although both results produce the same count rate, their statistical significance is not identical. The second measurement is based on considerably more registered events and therefore has a lower relative statistical fluctuation.
How does statistical uncertainty depend on the number of counts?
For an idealized Poisson count, the relative statistical standard deviation decreases with the square root of the number of registered counts.
| Registered counts | Approximate relative standard deviation | Assessment |
|---|---|---|
25 |
1 / √25 = 20 % |
Significant relative statistical fluctuation |
100 |
10 % |
Improved statistical significance |
400 |
5 % |
Considerably more stable result |
10,000 |
1 % |
Low relative statistical contribution |
This illustrates a central rule of counting statistics: to halve the relative statistical uncertainty, simply doubling the counting time is not sufficient. Under otherwise unchanged conditions, approximately four times as many counts must be registered.
A longer counting time therefore improves statistical precision very effectively, but not linearly.
Why does a longer counting time improve the result?
Assume that a nearly constant count rate of approximately 2.5 Ip/s is present on a surface. With a measuring time of ten seconds, approximately 25 counts are registered on average. The relative statistical standard deviation of the pure count measurement is approximately 20 %.
If the measurement is instead carried out for 100 seconds, approximately 250 counts are registered at the same count rate. The relative statistical standard deviation then decreases to approximately:
1 / √250 ≈ 6.3 %
The underlying process has not changed. The larger number of registered events simply allows a more stable estimate of the average count rate.
This effect is particularly important at low count rates. At very high count rates, many events are already registered within a short period of time. For a measurement only slightly above the background, however, a considerably longer counting time may be required.
Why must the background be considered statistically?
A contamination detector also registers counts when no contamination is present. This background or inherent count rate is caused, among other things, by natural environmental radiation and the detector itself.
This background is also not a perfectly constant number. During several consecutive measuring intervals, values such as 18, 21, 17 and 23 Ip/s may occur even though the environment has not changed.
A background value should therefore not be derived from an extremely short single measurement. Especially if small net count rates are to be evaluated later, the background must be determined over a sufficiently long period and under conditions that are as comparable as possible.
For the GRAETZ CoMo-170, for example, a typical background of approximately 15 ... 20 Ip/s is specified for the β/γ channel. For the α channel, the typical background is considerably lower due to the detector and radiation characteristics. Such device-specific values also demonstrate why alpha and beta/gamma measurements cannot be treated statistically in exactly the same way.
Correctly distinguishing gross and net count rate
The count rate measured on a surface being investigated generally contains both possible contamination counts and background counts.
In simplified form, a net count rate can be calculated as:
Rnet = Rmeasurement - Rbackground
For example:
Rmeasurement = 24 Ip/s
Rbackground = 18 Ip/s
This formally results in:
Rnet = 6 Ip/s
However, the statement “There are definitely 6 Ip/s of contamination” would go too far. Both the measurement and the determination of the background have statistical uncertainties. With small differences, these uncertainties may represent a significant proportion of the net count rate.
For independently determined count numbers, the uncertainty contributions from the measurement and the background are therefore considered together. A long background measurement can be particularly helpful because it reduces the statistical contribution of the background value.
What does detection limit mean in contamination measurement?
In simplified terms, the detection limit does not answer the question of the smallest numerical value that can appear on a display. Rather, it describes the minimum actual activity or net count rate that can be detected with a specified statistical level of confidence.
Different terms must be distinguished in this context. In radiation measurement technology, the concepts of decision threshold and detection limit are particularly relevant. Their exact determination depends on the measurement method, background, measuring time, calibration factor and the specified statistical probabilities.
A general rule such as:
Detection limit = 2 × background
is therefore not a universally valid calculation method.
For formal detection limits in radiation protection measurements, appropriate statistical methods and normative requirements are used. The key practical point is this: the smaller the expected signal is compared with the background, the more strongly counting time and background statistics influence the ability to detect it.
Why does a longer measuring time not eliminate geometry errors?
A longer counting time reduces random statistical fluctuations. However, it cannot eliminate systematic measurement errors.
If the probe is positioned, for example, 5 mm above the same surface during one measurement and 30 mm above it during the next, the results cannot be compared directly. Alpha radiation in particular has only a short range in air and is extremely sensitive to distance, shielding and the detector foil.
The orientation of the probe, the size of the contaminated area, the surface condition and the radionuclide present also influence the registered count rate.
| Influence | Can it be reduced by a longer counting time? |
|---|---|
| Random counting statistics | Yes |
| Poorly determined background | Partly, by extending the background measurement |
| Incorrect measuring distance | No |
| Incorrect radionuclide-specific efficiency | No |
| Different measuring geometry | No |
| Damaged or contaminated detector foil | No |
A statistically very precise measurement can therefore still be physically incorrect if the measuring geometry is wrong.
Distinguishing surface scanning and quantitative measurement
In a practical contamination check, there are often two different tasks. First, a larger surface is to be scanned quickly for suspicious areas. Afterwards, a reliable measured value is to be determined at a suspicious location.
When scanning, a compromise must be found between surface scanning speed and detection capability. If the probe is moved very quickly across a surface, only a short effective observation time is available for each individual area. Weak local contamination can therefore be more easily overlooked.
If a suspicious location is found, the probe can subsequently be held stationary above the area with a defined geometry and a longer measurement can be carried out. This registers more counts and improves the statistical evaluation.
Fast scanning is therefore primarily used to locate suspicious areas. Quantitative assessment close to a decision threshold or detection limit, on the other hand, often requires a defined and longer measuring time.
Practical example: weak measured value just above background
Before starting a contamination check, a background of approximately 18 Ip/s is determined with the measuring instrument.
During short measurements on a stainless-steel surface, the following values are then observed:
21 Ip/s – 24 Ip/s – 19 Ip/s – 25 Ip/s
At first glance, the value of 25 Ip/s in particular could be interpreted as an indication of contamination. However, the values are each based only on short measuring intervals and the background itself also fluctuates statistically.
The suspicious location is therefore measured again over a considerably longer period while maintaining a constant distance. At the same time, the background is checked with a sufficiently long measuring time.
Only the comparison of these two statistically better determined values allows a more reliable assessment of whether a net count rate above the background is present.
If a subsequent conversion into Bq/cm² is required, additional factors such as the radionuclide-specific efficiency, the active detector area and the specified measuring geometry must also be taken into account.
A single temporarily elevated count-rate value is therefore not yet reliable evidence of contamination. The decisive question is whether the observed increase is sufficiently significant compared with the statistically fluctuating background.
Why individual measurements should not be compared too quickly
Assume that a surface produces 32 Ip/s during one measurement and 28 Ip/s after cleaning. It would be tempting to immediately interpret this as an improvement of approximately 12.5 %.
At low count numbers and short measuring times, however, this difference may lie entirely within the statistical fluctuation. Only when the measuring time, number of counts and background are known can the reliability of the observed change be assessed.
For comparison measurements, the following conditions in particular should therefore remain constant:
- same counting time,
- same measuring distance,
- same detector orientation,
- same or comparable measuring area,
- same measuring mode,
- comparable background.
For recurring decontamination checks, a defined measuring procedure can significantly improve comparability.
Systematic procedure
- Select a suitable detector for the expected type of radiation.
- Check the detector foil and device condition before measurement.
- Determine the background under comparable conditions.
- At low count rates, perform a sufficiently long background measurement.
- Keep measuring distance and geometry constant for comparison measurements.
- When rapidly scanning, first locate suspicious areas.
- Then remeasure suspicious locations while stationary and using a longer counting time.
- Do not automatically equate the gross count rate with the contamination count rate.
- For small net count rates, take statistical uncertainty into account.
- For formal release or limit-value decisions, use the defined measurement and evaluation procedure intended for this purpose.
- For conversion into Bq or Bq/cm², use the correct radionuclide-specific calibration factor or efficiency.
- Document counting time, background and measuring conditions together with the result.
Common mistakes
- Treating an individual count-rate value as exact: Every count measurement has a statistical fluctuation.
- Using a very short measuring time at a low count rate: This results in a large relative statistical uncertainty.
- Treating the background as a constant value: The inherent count rate also fluctuates statistically and must be determined sufficiently accurately.
- Confusing gross and net count rate: The measured value normally also contains the background.
- Using arbitrary multiples of the background as the detection limit: A formal detection limit depends on the complete statistical measurement procedure.
- Assuming that extending the measuring time eliminates systematic errors: Incorrect distance or efficiency is not corrected by measuring for longer.
- Comparing two measured values without knowing the counting time: Identical count rates can have very different statistical quality.
- Scanning too quickly: Weak local contamination can be overlooked because of the short effective measuring time.
- Interpreting Ip/s directly as Bq/cm²: Additional measurement- and radionuclide-specific parameters are required for this conversion.
GRAETZ CoMo-170 for contamination measurements
One specific instrument for mobile contamination measurement is the GRAETZ CoMo-170. The contamination monitor uses a thin-layer plastic scintillation detector with ZnS coating and can be used for sensitive measurement of alpha, beta and gamma contamination.
The active detector area is 170 cm². This allows larger surfaces to be checked comparatively efficiently. Depending on the measuring mode, the measured value can be displayed as a count rate in Ip/s or on a radionuclide-specific basis in Bq or Bq/cm².
The count display is particularly useful for statistical evaluations. It allows the user to see directly that the count rate is not a perfectly constant measured value, but is derived from individual registered events.
The CoMo-170 has separate alpha and beta/gamma measuring channels. For the β/γ channel, a typical background of approximately 15 ... 20 Ip/s is specified. For the alpha channel, the typical background is considerably lower. These differences must be taken into account in practical evaluation.
Suitable instruments can be found under radiation measurement technology at ICS Schneider and specifically under contamination monitors. Further information on the instrument used here can be found under GRAETZ CoMo-170 contamination monitor.
Conclusion
Contamination measurements are based on individual statistically occurring counts. Therefore, even a completely unchanged measuring point will normally not produce exactly identical count values during repeated measurements.
The relative statistical uncertainty decreases as more counts are registered. A longer counting time is therefore an effective way of obtaining a more stable average value, particularly at low count rates. However, the improvement follows the square root of the number of counts: approximately four times as many counts are required to halve the relative statistical contribution.
Assessment close to the background is particularly critical. Both the measurement and the background fluctuate statistically. A small difference between the two values is therefore not automatically reliable evidence of contamination.
A detection limit must also not be equated with an arbitrary fixed multiple of the background. For formal decisions, measuring time, background, calibration, uncertainties and the specified statistical criteria must be considered together.
A longer counting time also does not eliminate systematic errors. Measuring distance, detector, radionuclide, efficiency and surface geometry remain decisive for the physical validity of the result.
For a reliable contamination measurement, the following therefore applies: first determine the background properly, use a sufficiently long measuring time at low count rates, do not confuse statistical fluctuations with real changes in activity and make detection or limit-value decisions only using a defined measurement procedure intended for this purpose.
FAQ: Counting time and statistics in contamination measurements
Why does the display of a contamination monitor fluctuate?
Radioactive decays and the resulting detector events occur statistically. Therefore, even under unchanged conditions, exactly the same number of counts will normally not be registered during two equally long measuring intervals.
What does count rate mean?
The count rate indicates how many detector events are registered per unit of time. It is specified, for example, in counts per second or Ip/s.
Why is a longer counting time more accurate?
With a longer counting time, more counts are normally registered. This reduces the relative statistical fluctuation of the measurement result.
How does statistical uncertainty depend on the number of counts?
For an approximate Poisson distribution, the standard deviation of the number of counts is approximately the square root of N. The relative standard deviation is therefore approximately 1 divided by the square root of N.
How can statistical uncertainty be halved?
Under otherwise identical conditions, approximately four times as many counts must be registered. This can be achieved, for example, by using a counting time four times as long.
What is the background in a contamination measurement?
The background or inherent count rate refers to the counts registered even without the contamination being investigated. This includes natural environmental radiation and instrument-related counts, among other things.
Does a measurement above the background automatically prove contamination?
No. Particularly with small differences, it must be taken into account that both the background and the measured value fluctuate statistically. Measuring time and uncertainty must be considered for a reliable decision.
Is the detection limit simply twice the background?
No. A formal detection limit results from a statistical measurement and evaluation procedure and depends, among other things, on background, measuring time, calibration and the specified decision probabilities.
Can every measurement error be eliminated simply by measuring for a very long time?
No. A longer counting time reduces random counting fluctuations. Systematic errors caused by incorrect measuring distance, an unsuitable detector, incorrect efficiency or incorrect measuring geometry remain.
Why is rapid scanning less sensitive than a stationary measurement?
During rapid scanning, the detector remains above each individual surface area only briefly. With weak contamination, only a few additional counts may therefore be registered. A longer stationary follow-up measurement improves the statistical significance.
Can a count rate be converted directly into Bq/cm²?
Not without additional information. The background, radionuclide-specific efficiency or calibration factor, detector area and measuring geometry must all be taken into account.
Which specific instrument is suitable for surface contamination measurements?
One suitable example is the GRAETZ CoMo-170. It has a 170 cm² plastic scintillation detector for alpha, beta and gamma contamination and can display measured values as a count rate as well as on a radionuclide-specific basis in Bq or Bq/cm².