


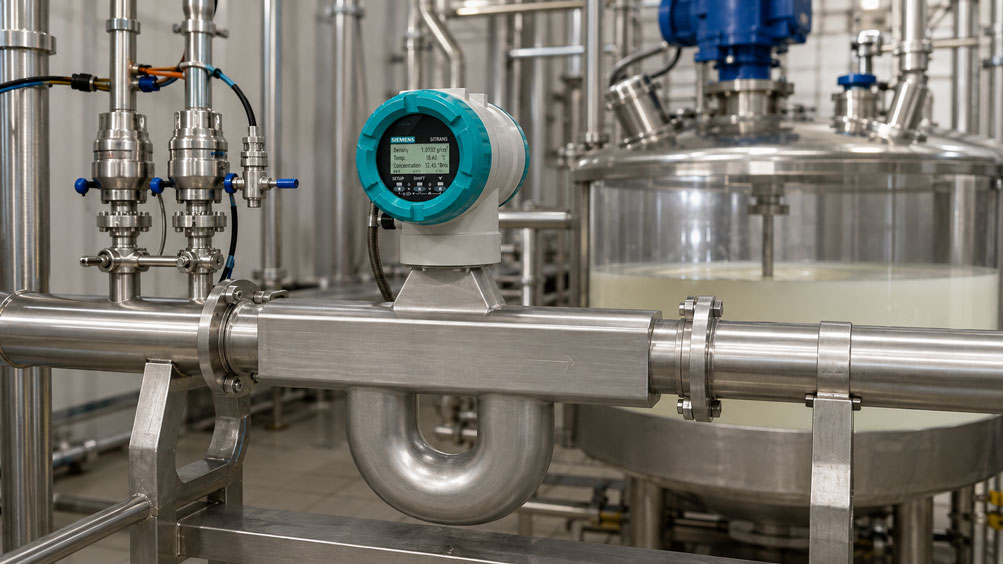
Coriolis density measurement can continuously determine the concentration of a liquid mixture in the process when the relationship between density, temperature and the composition of the specific product is known and correctly stored.
A Coriolis flowmeter does not only measure mass flow. The density of the medium can also be determined from the vibration behavior of its measuring tubes, while an integrated temperature sensor measures the process temperature.
This provides exactly the variables required for many inline concentration measurements:
Concentration = f(Density, Temperature, Product characteristic curve)
However, the final component of this relationship is crucial. The same density can correspond to different concentrations at different temperatures. Likewise, two different products with the same density can have completely different compositions.
Precise density measurement alone is therefore not yet a concentration measurement. Only the correct temperature-dependent product characteristic curve turns the measured density value into a reliable concentration value.
A particularly suitable solution for these applications is the Siemens SITRANS FCT040 transmitter. In addition to mass flow, density and temperature, it also supports functions for concentration or fraction measurement. As part of a complete Coriolis measuring system, it can be used, for example, in the SITRANS FC540 or, for low flow rates, in the SITRANS FC140.
Further solutions can be found under Coriolis flow measurement technology and in the complete range of flow measurement technology at ICS Schneider.
Table of Contents
- How does a Coriolis meter measure density?
- How is concentration calculated from density?
- Why must temperature be taken into account?
- Why is the product characteristic curve crucial?
- Interpreting Brix and other concentration units correctly
- Considering product changes and recipe changes
- When does the density-concentration method work particularly well?
- Limits with multi-component mixtures
- Why do gas bubbles interfere with density measurement?
- Ensuring completely filled measuring tubes
- What does the zero point have to do with concentration measurement?
- Checking density measurement instead of making incorrect adjustments
- Influence of process pressure
- Installing the Coriolis meter correctly
- Mixing, dosing and rapid concentration changes
- Comparing inline values with a laboratory reference
- Practical example: concentration drifts with temperature
- Typical fault patterns
- Recommended design and test procedure
- Suitable Coriolis systems from ICS Schneider
- Conclusion
- FAQ
How does a Coriolis meter measure density?
In a Coriolis flowmeter, one or more measuring tubes are deliberately excited into vibration.
Mass flow is determined from the change in tube vibration caused by the Coriolis force.
At the same time, the natural frequency or vibration period of the measuring tube depends on its total mass.
This essentially consists of:
- the known mass of the measuring tube,
- the mass of the medium inside the measuring tube.
If the density of the medium changes, the mass of the filled measuring tube also changes and therefore so does its vibration behavior.
The electronics calculate the current liquid density from this relationship.
Several process variables from one measuring system
A modern Coriolis system can simultaneously measure or calculate:
- mass flow,
- density,
- process temperature,
- volume flow,
- concentration or fraction.
This combination is particularly useful for mixing, dosing and quality processes because a separate density sensor in a bypass line may not be required.
How is concentration calculated from density?
The density of a mixture often changes systematically with the proportion of its components.
For a mixture consisting of a carrier substance A and a component B, a concentration can, for example, be expressed as:
c = mB / (mA + mB)
The density can then be expressed in simplified form as a function:
ρ = f(c, T)
For evaluation, this relationship is inverted:
c = f(ρ, T)
The transmitter therefore measures the current density and temperature and calculates the concentration from these values using a stored characteristic curve.
Typical applications
- sugar in water,
- alcohol-water mixtures,
- alkalis and acids,
- glycol-water mixtures,
- CIP cleaning media,
- syrups and beverage bases,
- chemical solutions and mixing processes.
Whether the method is suitable depends on whether there is a sufficiently unique relationship between density, temperature and the required concentration value.
Why must temperature be taken into account?
Liquids change their density with temperature.
For many liquids, density decreases as temperature rises even though their chemical composition does not change at all.
Without temperature compensation, this creates an apparent concentration error
Assume that a solution has a constant composition throughout the entire process.
However, the temperature rises from:
20 °C
to:
50 °C
The measured density changes.
If the evaluation used only a density-concentration characteristic curve for 20 °C, it would incorrectly calculate a change in concentration from this density change.
The correct evaluation therefore requires both measured values
Density + Temperature
The product characteristic curve describes the density of the respective mixture at a specific concentration and temperature.
Temperature compensation therefore does not mean simply applying an arbitrary correction factor to the measured value. The stored relationship must match the actual substance system and the valid temperature range.
Why is the product characteristic curve crucial?
A density of, for example, 1,100 kg/m³ does not by itself provide a unique indication of concentration.
Depending on the medium, it can correspond to completely different compositions.
For concentration calculation, the following must therefore be known
- component or product,
- carrier liquid,
- required concentration definition,
- valid concentration range,
- valid temperature range.
A characteristic curve for:
Sucrose + Water
must not, for example, simply be used for:
Glycol + Water
.
Differences can also occur within the same product group
In addition to sugar, a beverage syrup may contain:
- acids,
- flavorings,
- salts,
- colorants,
- other dissolved solids.
Its density-concentration relationship therefore does not necessarily correspond exactly to that of a pure sucrose-water solution.
For demanding applications, the characteristic curve used should therefore always be verified against actual product samples or a suitable laboratory reference.
Interpreting Brix and other concentration units correctly
A commonly used concentration quantity in the food and beverage industry is:
°Bx
or degrees Brix.
For a pure sucrose-water solution, the Brix value corresponds to the mass fraction of sucrose.
Example
20 °Bx
corresponds, for the defined sucrose-water relationship, to a solution with the corresponding sugar mass fraction.
Real products require closer consideration
If the product contains dissolved substances in addition to sucrose, a Brix value calculated from density may be more of a process-related comparison value than an exact chemical analysis of the sucrose content.
The same principle applies to other quantities derived from density.
Depending on the application, the following can, for example, be output:
- mass percent,
- volume percent,
- °Bx,
- alcohol content,
- customer-specific fraction.
The unit must match the product characteristic curve being used.
Considering product changes and recipe changes
A correctly configured concentration measurement can suddenly provide plausible but incorrect values after a product change.
Typical example
A system initially processes product A.
A suitable density-temperature characteristic curve is stored for this product.
Later, product B is processed.
Both products have similar density ranges but different compositions.
If the characteristic curve for product A remains active, the measured density will still be processed mathematically correctly, but the result will not represent the actual concentration of product B.
For multi-product systems, it should therefore be clearly defined
- which product data set is active,
- when the system switches between characteristic curves,
- how transition and rinsing phases are handled,
- which values are valid during a product change.
A clear recipe or batch assignment via PLC or process control system is particularly useful.
When does the density-concentration method work particularly well?
Two-component systems are particularly suitable when density changes uniquely with composition over the relevant concentration and temperature range.
Typical examples include:
- sugar and water,
- glycol and water,
- certain alkalis and water,
- defined acid-water mixtures.
Uniqueness is important
For every pair of values consisting of:
Density + Temperature
it should be possible, as far as possible, to determine a unique concentration within the intended operating range.
If the characteristic curve contains regions with a low slope, even small density deviations can cause larger concentration deviations.
Limits with multi-component mixtures
For a mixture containing three or more variable components, density alone is often insufficient to determine the composition uniquely.
Example
A process medium contains:
- water,
- sugar,
- alcohol.
Different combinations of these three components may produce the same overall density.
Density and temperature alone then cannot uniquely determine the proportion of each individual component.
Coriolis density measurement remains useful nevertheless
It can, for example, be used for:
- recipe monitoring,
- detection of product deviations,
- trend monitoring,
- quality limits,
- process control to an empirically determined target value.
However, an additional measured variable or laboratory method may be required for an unambiguous chemical composition analysis.
Why do gas bubbles interfere with density measurement?
Entrained gas bubbles are among the most important interfering factors in Coriolis density and concentration measurement of liquids.
Gas has a much lower density than the liquid.
If the measuring tube contains liquid and gas at the same time, the mixture density detected by the sensor therefore changes.
Two-phase flow also affects the vibration behavior
Possible consequences include:
- density values that are too low or unstable,
- jumping concentration indication,
- unstable mass flow,
- increased measurement uncertainty,
- diagnostic messages from the measuring system.
Typical causes of gas in the medium
- leakage on the suction side of a pump,
- degassing due to pressure reduction,
- insufficient process pressure,
- strong foaming,
- empty or partially filled pipeline,
- air inclusion after maintenance work.
A concentration correction must not be used to mathematically conceal unstable two-phase flow. A reproducible single-phase measuring condition must first be established.
Ensuring completely filled measuring tubes
For reliable liquid density measurement, the measuring tubes must be completely filled with the process medium.
When planning the installation, care must therefore be taken to prevent gas pockets from collecting at the measuring device.
The following must be considered in particular
- mounting orientation,
- flow direction,
- position of pumps,
- highest or lowest point of the pipeline,
- process pressure,
- venting options.
The optimum orientation depends on the measuring device, pipe geometry and medium and should be selected according to the manufacturer’s specifications.
What does the zero point have to do with concentration measurement?
With a Coriolis meter, zero-point adjustment is often discussed.
However, a distinction must be made between mass-flow and density measurement.
The classic zero-point adjustment primarily concerns mass flow
With the measuring tube completely filled and the medium actually stationary, the zero signal of the flow measurement is determined.
An incorrect flow zero point can cause a significant measurement error, particularly at low mass flow rates.
However, an incorrect concentration indication is not automatically corrected by this
If the cause is, for example:
- an incorrect product characteristic curve,
- an incorrect temperature value,
- gas bubbles,
- incorrect density calibration
a new flow zero-point adjustment is not the correct measure.
Zero-point adjustment and density or concentration verification are two different tasks.
Checking density measurement instead of making incorrect adjustments
If the calculated concentration does not agree with a laboratory analysis, the measuring chain should be checked systematically to determine where the deviation occurs.
Recommended sequence
- Check the process condition for gas bubbles and complete pipe filling.
- Compare the measured temperature with a suitable reference.
- Compare the measured density with a suitable reference sample.
- Check the active product characteristic curve.
- Check reference conditions and concentration unit.
- Only then adjust the product correlation if necessary.
Important for sampling
The laboratory sample should represent the same process condition as the inline measurement as closely as possible.
If the sample and measured value are taken far apart in time, actual process changes may already distort the comparison.
Influence of process pressure
Process pressure is usually less prominent than temperature in density-concentration measurement, but it can also be relevant in demanding applications.
Pressure can have an effect in two ways
- the density of compressible media changes with pressure,
- the mechanical condition of the measuring tubes can be influenced by process pressure.
Particularly at high pressures, very high accuracy requirements or with highly compressible media, it should therefore be checked whether pressure compensation is required.
The SITRANS FCT040 also offers functions for dynamic pressure compensation.
Installing the Coriolis meter correctly
For the actual measurement, Coriolis meters do not require long straight inlet and outlet runs in many applications, unlike certain other flow measurement principles.
However, this does not mean that the installation conditions are arbitrary.
The following are particularly important for stable density and concentration measurement
- completely filled measuring tubes,
- no accumulation of gas or sediment,
- stress-free pipe installation,
- suitable pipe support,
- avoidance of strong external vibrations,
- sufficient process pressure to prevent degassing,
- suitable mounting orientation for the medium.
Avoid mechanical pipe stress
The flowmeter should not be used to mechanically pull poorly aligned pipes together.
Excessive pipe forces can change the measuring conditions and increase the mechanical load on the device.
Mixing, dosing and rapid concentration changes
In continuous mixing processes, concentration can be used directly as a control variable.
Example
A base medium is continuously mixed with a concentrated component.
The Coriolis flowmeter measures:
- mass flow,
- density,
- temperature,
- the concentration calculated from these values.
The concentration can then be transmitted to the PLC or process control system and used to control a dosing valve or pump.
Process dynamics must be taken into account
Between the:
- dosing point,
- mixing section,
- Coriolis meter
there is a real transport and mixing time.
An overly aggressive control strategy can therefore cause process oscillation despite very fast measured-value updates.
The measuring point should be located downstream of a sufficiently homogeneous mixing section.
Comparing inline values with a laboratory reference
For customer-specific products in particular, comparison with an established laboratory reference is recommended.
Procedure
- Run the product under stable process conditions.
- Store the density, temperature and calculated concentration from the Coriolis meter.
- Take a representative sample almost simultaneously.
- Analyze the sample using the established reference method.
- Compare several concentration and temperature points.
- Evaluate deviations over the entire operating range.
A single adjustment point is often not sufficient for a reliable product characteristic curve.
Several points reveal
- offset errors,
- slope errors,
- non-linearities,
- temperature dependencies.
Only then can it be determined whether a simple correction is sufficient or whether a dedicated product characteristic curve is required.
Practical example: concentration drifts with temperature
In a mixing system, the concentration of an aqueous process solution is monitored using the inline density measurement of a Coriolis flowmeter.
At the start of production, the temperature is:
20 °C
The indication agrees with the laboratory analysis.
During production, the temperature rises to:
45 °C
The recipe and therefore the actual proportion of substances remain unchanged.
Fault pattern
The indicated concentration nevertheless decreases continuously.
Initial check
Mass flow and density values are stable and plausible.
There are no indications of gas bubbles.
Cause
The evaluation used only a simple density-concentration assignment at a fixed reference temperature.
The actual temperature-dependent product characteristic curve was not taken into account.
Solution
The concentration calculation is changed to a suitable density-temperature characteristic curve for the actual product.
Several operating points are then checked using laboratory samples.
Result
The calculated concentration now remains within the required tolerance even when the process temperature changes.
This example shows why even a highly accurate density value can still result in an incorrect concentration: the metrological quality of density measurement and the quality of the product characteristic curve are two separate components of the overall measurement.
Typical fault patterns
| Observation | Possible cause | Recommended check |
|---|---|---|
| Concentration changes with temperature | Temperature compensation or characteristic curve incorrect | Check product characteristic curve and temperature value |
| Density is correct, but concentration is not | Incorrect product data set | Check active characteristic curve and unit |
| Density fluctuates strongly | Gas bubbles or two-phase flow | Check pipe filling and process pressure |
| Density is permanently too low | Entrained gas or incorrect density calibration | Check process condition and reference density |
| Measurement is no longer correct after product change | Characteristic curve of previous product still active | Check recipe or data-set switching |
| Laboratory value and inline value differ constantly | Offset or different reference conditions | Compare simultaneous sample and inline value |
| Deviation increases at high concentration | Incorrect characteristic-curve slope or non-linearity | Check several concentration points |
| Only mass flow is incorrect at low rates | Flow zero point | Check zero point under correct conditions |
| Concentration error remains after zero-point adjustment | Error is not caused by the flow zero point | Check density, temperature and product characteristic curve |
| Measurement unstable after pump start | Air intake or cavitation | Check suction side, pressure level and pump operation |
| Value is correct for one product but not another | Different density-concentration relationship | Use product-specific characteristic curve |
| Brix does not match laboratory result | Product is not a pure sucrose-water solution or reference method differs | Check product matrix and reference definition |
| Measured value slowly drifts during operation | Deposits or changed measuring-tube properties | Check diagnostics and tube condition |
Recommended design and test procedure
- Define the measuring task: Determine which concentration quantity is required.
- Check product composition: Distinguish between two-component and multi-component mixtures.
- Determine concentration range: Record minimum and maximum operating values.
- Determine temperature range: Consider actual process limits.
- Determine density range: Determine product densities across the operating range.
- Select product characteristic curve: Use a manufacturer characteristic curve or customer-specific data set.
- Define the unit: For example mass %, volume % or °Bx.
- Select the Coriolis system: Consider flow rate, nominal size, material and process connection.
- Consider density accuracy: Do not compare mass-flow accuracy alone.
- Define mounting orientation: Ensure complete pipe filling and absence of gas.
- Check process pressure: Avoid degassing or cavitation.
- Install pipes without mechanical stress: Avoid additional mechanical loads.
- Check temperature reading: Verify plausibility before concentration adjustment.
- Check density value: Use a suitable reference sample or reference medium.
- Consider zero point separately: Correct the flow zero point only when it is actually the cause.
- Record several reference points: Vary concentration and temperature over the relevant range.
- Perform laboratory comparison: Take samples as close in time as possible to the inline values.
- Verify product characteristic curve: Evaluate offset, slope and temperature behavior.
- Define product changeover: Specify automatic or manual characteristic-curve switching.
- Diagnose gas bubbles: Do not compensate unstable density values by changing the characteristic curve.
- Configure limit values: Detect implausible density, temperature or concentration values.
- Document the measuring point: Record product, characteristic curve, temperature range and reference method.
- Verify regularly: Particularly after product, process or maintenance changes.
Suitable Coriolis systems from ICS Schneider
Siemens SITRANS FCT040 – for density and inline concentration
The Siemens SITRANS FCT040 is the advanced transmitter of the SITRANS FC Coriolis range and is particularly suitable for applications in which additional process information is required in addition to flow.
Depending on the version or configuration, the available measurement and evaluation functions include:
- mass flow,
- density,
- temperature,
- volume flow,
- concentration or fraction,
- viscosity,
- thermal energy.
For the FCT040, depending on the corresponding system configuration, a typical density measurement accuracy of up to:
±0.5 kg/m³
is specified.
Functions for standard concentration measurement and advanced fraction measurement are also available.
Preconfigured concentration applications
For suitable configurations, predefined substance systems are available, including:
- sucrose/water with output in °Bx,
- sodium hydroxide/water,
- potassium hydroxide/water,
- hydrochloric acid/water,
- ethylene glycol/water,
- methanol/water,
- alcohol/water.
The permissible concentration and temperature ranges for the respective application must be taken into account when selecting the device.
SITRANS FC540 – universal and hygienic applications
The SITRANS FC540 combines the FCS500 sensor with the advanced FCT040 transmitter.
The system is particularly suitable for applications in:
- food industry,
- beverage industry,
- pharmaceutical industry,
- general process industry.
The FCS500 is available with double-curved measuring tubes made of AISI 316L stainless steel and can be configured with hygienic process connections.
SITRANS FC140 – low flow rates and high-value media
The SITRANS FC140 combines the FCS100 precision sensor with the FCT040.
It is particularly suitable for:
- low flow rates,
- pilot plants,
- research and development,
- high-value additives,
- precise mixing and dosing processes.
For concentration measurement at low process flow rates, this combination is particularly useful because mass flow, density and temperature are available within the same multiparameter measuring system.
Further systems can be found under Coriolis flow measurement at ICS Schneider.
Conclusion
Coriolis density measurement provides a powerful method for determining the concentration of liquid mixtures directly and continuously within the process.
Density alone is not sufficient
To determine concentration, it must be known how density, temperature and composition of the specific product are related.
Temperature compensation is essential
A temperature-induced density change must not be interpreted as a change in product concentration.
The product characteristic curve determines the quality of the conversion
A characteristic curve must match the actual substance system, concentration range and temperature range.
Product changes require the correct characteristic curve
A metrologically correct density value can still result in an incorrect concentration indication if the wrong product data set is used.
Gas bubbles are a process problem
Two-phase flow affects density and Coriolis measurement and should not be concealed by mathematical corrections.
Zero point and density are separate issues
The classic Coriolis zero-point adjustment primarily concerns mass flow and does not correct an incorrect concentration characteristic curve.
Laboratory comparison remains important for customer-specific products
Several reference points across the concentration and temperature range show whether the stored product correlation describes the actual process with sufficient accuracy.
For practical applications
Define product and concentration quantity → determine temperature and density range → select a suitable product characteristic curve → define the required Coriolis density accuracy → ensure completely filled and gas-free measuring tubes → independently verify density and temperature plausibility → compare several concentration and temperature points with laboratory references → verify the characteristic curve → clearly define product switching → regularly monitor diagnostics and tube condition.
FAQ: Determining Concentration with Coriolis Density Measurement
Can a Coriolis flowmeter measure density?
Yes. Density is determined from the vibration behavior or natural frequency of the measuring tubes filled with the process medium.
Can concentration be calculated directly from density?
Only if a suitable relationship between density, temperature and concentration is known for the specific product.
Why is temperature required?
Because the density of a medium changes with temperature. Without temperature compensation, this density change could incorrectly be interpreted as a concentration change.
What basic equation applies to concentration calculation?
In simplified form: Concentration = f(Density, Temperature, Product characteristic curve).
What is a product characteristic curve?
It describes the relationship between density, temperature and composition of a defined substance system.
Can the same characteristic curve be used for different liquids?
No. Different substance systems have different density-concentration relationships.
What happens if the wrong characteristic curve is active?
The density may be measured correctly while the concentration calculated from it is still incorrect.
What does Brix mean?
For a defined sucrose-water solution, °Bx describes the corresponding sugar mass fraction. With complex products, additional dissolved substances can affect interpretation.
Can a Coriolis meter output Brix?
Suitably configured SITRANS FC systems with FCT040 support concentration or fraction functions for sucrose-water mixtures with output in °Bx, among other applications.
Can alcohol concentration also be measured?
For suitable alcohol-water mixtures, corresponding concentration or fraction functions are available, provided the defined substance and temperature range is maintained.
Does the method work for every two-component mixture?
It is particularly suitable when density and temperature allow a unique assignment to concentration within the relevant operating range.
What about three or more components?
In such cases, composition often cannot be determined uniquely from density and temperature alone. An additional measured variable or laboratory analysis may be required.
Why are gas bubbles problematic?
They change the effective density of the medium and also influence the vibration behavior of the Coriolis measuring tubes.
How can gas bubbles in the process be detected?
Typical indications include unstable density and flow values, unexpectedly low density and corresponding diagnostic messages from the measuring system.
Does the measuring tube have to be completely filled?
Yes. For reliable liquid density and concentration measurement, the measuring system should be completely and reproducibly filled with the medium.
Does a Coriolis meter require straight inlet runs?
Long straight inlet runs are not required in many applications. Nevertheless, the manufacturer’s specific installation instructions and a completely filled, mechanically correct installation must still be observed.
What does Coriolis zero-point adjustment do?
It is primarily used to correct the mass-flow zero signal when the measuring tube is completely filled and the medium is actually stationary.
Does a zero-point adjustment improve density measurement?
A flow zero-point adjustment does not correct an incorrect product characteristic curve and is not the same as density calibration.
How should an incorrect concentration indication be investigated?
First check the process condition, absence of gas, temperature value and density measurement. Then check the product characteristic curve and concentration scaling.
Why is laboratory comparison useful?
It can be used to verify whether the stored density-temperature correlation represents the actual product with sufficient accuracy over the complete operating range.
Is a single laboratory point sufficient?
For a reliable characteristic curve, several concentration and temperature points should be investigated whenever possible.
How should the sample be taken?
The sample should be as representative as possible and taken as close in time as possible to the stored inline measured value.
Can process pressure influence density?
Yes. Pressure dependence can become relevant particularly at high pressures or with compressible media.
Which Siemens transmitter is particularly suitable for concentration measurements?
The SITRANS FCT040 supports advanced measurement and evaluation functions for concentration or fraction.
What density accuracy does the SITRANS FCT040 offer?
For appropriately configured systems, a typical density measurement accuracy of up to ±0.5 kg/m³ is specified.
Which system is suitable for hygienic applications?
The SITRANS FC540 combines the FCS500 sensor with the FCT040 and is also available for hygienic applications.
Which system is suitable for low flow rates?
The SITRANS FC140 combines the FCS100 precision sensor with the FCT040 and is designed for applications with low flow rates.
Can the FCT040 measure values other than concentration?
Depending on the configuration, available values include mass flow, density, temperature, volume flow, concentration or fraction, viscosity and thermal energy.
Where can I find further Coriolis flowmeters?
Further devices can be found under Coriolis flow measurement technology at ICS Schneider.