


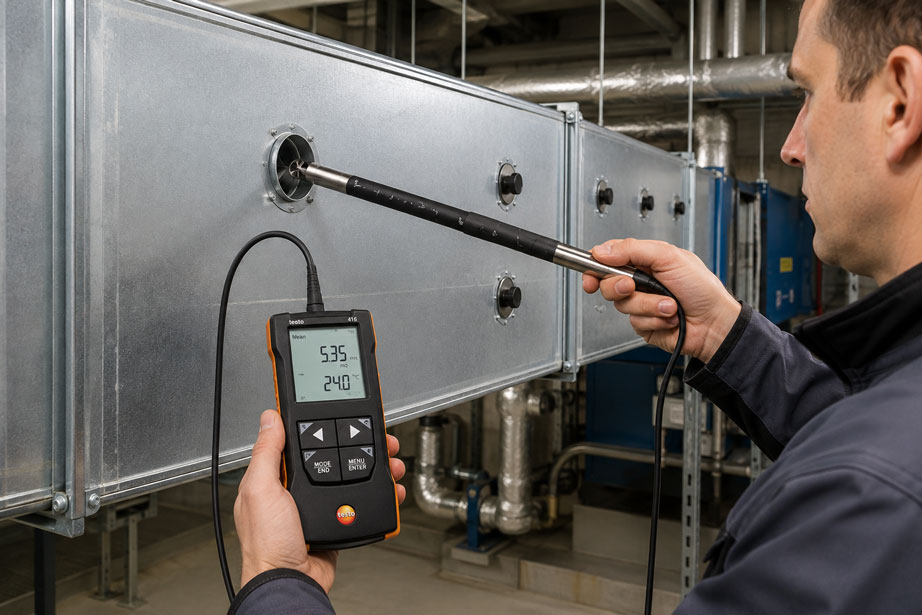
The air volume flow in a ventilation duct is to be checked. For this purpose, the air velocity is measured in the center of the duct using an anemometer. The measuring instrument shows, for example, 5.3 m/s. This value is multiplied by the duct cross-section to calculate the volume flow.
Mathematically, this initially makes sense:
Volume flow = air velocity × duct cross-section
From a measurement perspective, however, the result can still be significantly incorrect.
The reason: The air velocity is normally not distributed uniformly across the cross-section of a real ventilation duct. Near the walls, the velocity is lower due to friction, while it can be higher in other areas. Downstream of bends, dampers, filters, fans, branches or changes in cross-section, strongly asymmetrical profiles, swirl and local velocity peaks can also occur.
A single point measurement in the center of the duct can therefore provide a plausible value without correctly representing the actual mean volume flow.
For a reliable measurement, the duct area is therefore divided into several sections and the velocity is measured at several defined points. A representative mean air velocity is then determined from these individual values.
Suitable instruments can be found at ICS Schneider under Flow Measuring Instruments / Flow Sensors. Further solutions for indoor climate, humidity and flow measurements can be found under Humidity and Flow.
Table of Contents
- Calculate volume flow from air velocity and cross-section
- Why a single point measurement is often insufficient
- Determine the duct cross-section correctly
- Select a suitable measuring point in the ventilation duct
- Consider straight duct lengths and flow disturbances
- Set up a measurement grid across the duct cross-section
- Log-Tchebycheff method
- Calculate the mean correctly from point measurements
- Vane anemometers in ventilation ducts
- Thermal anemometers in ventilation ducts
- Probe position and alignment
- Recognize swirl and asymmetrical flow profiles
- Air density and density correction
- Evaluate measurement uncertainty correctly
- Document the measurement reproducibly
- Typical error patterns
- Systematic procedure for duct measurements
- Practical example: single-point measurement overestimates the volume flow
- Suitable ICS products
- Conclusion
- FAQ
Calculate volume flow from air velocity and cross-section
The volume flow of an air stream is generally calculated as follows:
Q = v̄ · A
where:
- Q = volume flow in m³/s,
- v̄ = mean air velocity across the duct cross-section in m/s,
- A = free duct cross-sectional area in m².
If the result is to be stated in m³/h:
Q = v̄ · A · 3600
The small detail above the velocity symbol is crucial:
v̄
The objective is not to determine just any local velocity, but the velocity averaged across the entire effective cross-section.
This is precisely the challenge in practical duct measurement.
Why a single point measurement is often insufficient
In a real ventilation duct, the air does not have a perfectly uniform velocity profile.
Typically:
- velocity is lower near the walls,
- it can be higher in central areas,
- bends shift the velocity maximum,
- dampers can accelerate or decelerate partial air streams,
- fans can generate swirl,
- filters or heat exchangers can alter the profile,
- branches can cause one-sided flow patterns.
If the measurement is taken only in the center of the duct, there is therefore a risk of measuring an area with above-average velocity.
The volume flow calculated from this value will then be too high.
Conversely, a poorly positioned single-point measurement can also produce a value that is too low.
High anemometer accuracy cannot compensate for a non-representative flow profile.
A measuring instrument with, for example, a very small device error can therefore still result in an incorrect volume flow if the measuring point or measurement grid is selected incorrectly.
Determine the duct cross-section correctly
In addition to velocity, the actual flow cross-sectional area must also be determined correctly.
Rectangular duct
For a rectangular duct:
A = a · b
Example:
a = 0.8 m
b = 0.5 m
This gives:
A = 0.8 · 0.5 = 0.40 m²
Round duct
For a round duct:
A = π · D² / 4
For a diameter of 500 mm, or 0.5 m:
A = π · 0.5² / 4 ≈ 0.196 m²
Consider the free cross-section
The nominal duct dimensions do not always correspond exactly to the actual free flow area.
For example, the following should be taken into account:
- internal fittings,
- measurement lances,
- damper shafts,
- silencers,
- filter frames,
- heavy deposits.
In normal duct measurements, their influence is often small. With large internal components or small duct cross-sections, however, the difference can become relevant.
Select a suitable measuring point in the ventilation duct
The quality of a volume flow measurement is already significantly influenced by the selection of the measuring point.
Ideally, the measurement is performed in a straight section of duct with the most uniform flow possible.
Unfavorable measuring points are located directly:
- downstream of a 90° bend,
- downstream of a throttle damper,
- downstream of a fan,
- downstream of a major change in cross-section,
- downstream of a T-piece,
- directly upstream or downstream of a branch.
The more strongly the flow profile is disturbed, the more measuring points are required and the greater the uncertainty of the determined volume flow will normally be.
Consider straight duct lengths and flow disturbances
After a flow disturbance, the flow requires a certain distance to stabilize again.
For duct traverses, the hydraulic diameter is often used as a reference.
For non-circular ducts:
Dh = 4 · A / P
where:
- Dh = hydraulic diameter,
- A = cross-sectional area,
- P = wetted perimeter of the duct.
For a rectangular duct with width a and height b:
Dh = 2 · a · b / (a + b)
As a useful guideline, a measuring point should, where possible, be located:
- several hydraulic diameters downstream of a disturbance,
- and several hydraulic diameters upstream of the next disturbance.
In practice, however, an ideal straight section is often not available.
In that case:
Do not simply switch to a single-point measurement. Instead, capture the disturbed profile using an appropriate measurement grid and document the unfavorable measuring position.
Set up a measurement grid across the duct cross-section
In a grid measurement, the duct cross-section is divided into several measuring areas.
The air velocity is then measured at several defined points.
A simple principle for a rectangular duct is, for example:
- 3 × 3 measuring points,
- 4 × 4 measuring points,
- 5 × 5 measuring points
or a correspondingly denser grid.
The required number depends, among other things, on:
- duct size,
- shape of the cross-section,
- expected flow profile,
- distance from disturbances,
- required measurement uncertainty,
- applicable standard or test procedure.
A larger grid requires more effort, but enables a much better assessment of the actual velocity profile.
Why edge areas must also be measured
A typical mistake is to measure several points but place them only in the central area of the duct.
This does not adequately account for the slower area near the walls.
The resulting mean value can therefore still be too high.
A suitable grid must therefore represent the entire cross-section, including the areas close to the walls.
Log-Tchebycheff method
An established method for traverses in ventilation ducts is the Log-Tchebycheff method, often also referred to as the Log-T method.
The measuring points are not simply distributed at constant intervals across the duct.
Their positions are selected so that the typical velocity profile, including the drop in velocity near the walls, is taken into account more effectively.
In a rectangular duct, this creates a grid of defined positions across the width and height.
With an example distribution using five positions per axis, the points are located approximately at:
- 7.5%,
- 28.8%,
- 50%,
- 71.2%,
- 92.5%
of the respective duct dimension.
Combining both axes creates, for example, a 5 × 5 grid with 25 measuring positions.
For measurements performed in accordance with standards, the exact measuring-point positions and number of points should always be taken from the applicable test procedure.
The practical advantage of the method:
The velocity distribution in the duct is captured much more realistically than with a single measurement in the center of the duct.
Calculate the mean correctly from point measurements
After the grid measurement, a mean air velocity must be calculated from the individual values.
If each measuring point represents an equally sized partial area, the arithmetic mean can be used:
v̄ = (v₁ + v₂ + ... + vₙ) / n
Then:
Q = v̄ · A
Area-weighted averaging
If the individual measuring points represent partial areas of different sizes, the values must not simply be weighted equally.
An area-weighted calculation is then required:
v̄ = Σ(vᵢ · Aᵢ) / ΣAᵢ
or directly:
Q = Σ(vᵢ · Aᵢ)
This gives each measured value the correct weighting according to the duct area it represents.
Averaging in the measuring instrument
Modern flow measuring instruments can significantly simplify averaging.
With point averaging, the individual measured values are recorded one after another and then averaged by the instrument.
This is particularly practical for duct traverses.
With time averaging, on the other hand, the measurement is taken over a defined period at the same position.
The two methods serve different purposes:
- point averaging: spatial velocity distribution across the duct,
- time averaging: temporal fluctuations at one measuring position.
For strongly fluctuating flow, it can be useful to first determine a time average at each grid point and then calculate the spatial mean from these values.
Vane anemometers in ventilation ducts
Vane anemometers are particularly practical for many duct measurements.
The air flow causes the vane to rotate. The flow velocity is determined from its rotational speed.
Advantages include:
- robust measuring principle,
- good suitability for typical duct velocities,
- straightforward operation,
- direct velocity measurement,
- good accessibility to deeper measuring points when used with a suitable telescopic probe.
For a grid measurement, the vane must be correctly aligned with the flow direction at every measuring point.
A compact vane with a small diameter is more suitable for measurements inside ducts than a very large vane that would occupy a significant proportion of the cross-section.
Thermal anemometers in ventilation ducts
Thermal anemometers operate using a heated sensor element.
The passing air removes heat from the sensor. The flow velocity is determined from this heat transfer.
Thermal sensors provide high sensitivity particularly at low air velocities and often have very small probe dimensions.
This is particularly useful for:
- low duct velocities,
- small duct cross-sections,
- detailed velocity profiles,
- cleanroom and laboratory applications.
Depending on the sensor, the following must be considered:
- correct probe alignment,
- temperature range,
- gas composition,
- strong turbulence,
- contamination of the sensor element.
In contaminated process air, a thermal sensor can be more sensitive to deposits than a robust vane.
Probe position and alignment
A correct measurement grid alone is not sufficient. The probe must also be positioned reproducibly.
The following should be considered in particular:
- correct insertion depth,
- correct alignment with the main flow direction,
- as consistent a holding time as possible at each measuring point,
- no contact with the duct wall,
- no unintentional movement during the measurement.
With a telescopic probe, the required insertion depth can be marked in advance or determined using the scale.
This makes the grid positions significantly more reproducible.
Probe blockage in small ducts
In small ducts, the probe itself can also influence the flow field.
The larger the probe and probe tube are relative to the duct cross-section, the more likely they are to affect the local flow.
For small cross-sections, probes should therefore be as compact as possible.
Recognize swirl and asymmetrical flow profiles
A grid measurement provides more than just a mean value.
It also shows how uniformly or non-uniformly the flow is distributed within the duct.
For example, a measurement series could show:
| Area | Typical observation | Possible cause |
|---|---|---|
| Left side of the duct significantly faster | Asymmetrical profile | Bend, branch or damper position |
| Center very fast, edge areas slow | Pronounced velocity profile | Normal wall friction or short straight inlet section |
| Velocity fluctuates strongly | Unsteady flow | Fan, control system or turbulent disturbance |
| Measured values change strongly with probe angle | Flow is not axial | Swirl or cross-flow |
| One individual area is very slow | Local flow disturbance | Internal component, damper or geometric disturbance |
An extremely non-uniform profile should therefore not simply be made “invisible” by averaging.
It is also important information about the system itself.
Air density and density correction
When calculating volume flow, a distinction must be made between actual volume flow, standard volume flow and mass flow.
Volume flow under current operating conditions
If the local air velocity is measured directly with a suitable anemometer and the actual volume flow under the current duct conditions is to be determined, the following generally applies:
Q = v̄ · A
An additional general density correction is not simply applied afterwards to this geometric relationship.
Determining velocity from dynamic pressure
The situation is different when velocity is determined from dynamic pressure, for example using a Pitot or Prandtl tube.
In simplified form:
v ≈ √(2 · Δpdyn / ρ)
Here, the air density directly influences the calculation of velocity.
Mass flow
For mass flow:
ṁ = ρ · Q
Density is therefore also required directly.
Standard volume flow
If a measured actual volume flow is to be converted to defined reference conditions, the following in particular must be considered:
- temperature,
- absolute pressure,
- air humidity where applicable.
For dry air and a simplified ideal-gas approximation, for example:
Qref = Q · (p / pref) · (Tref / T)
The reference conditions used must always be stated.
“m³/h” and “standard m³/h” are therefore not automatically the same.
Evaluate measurement uncertainty correctly
The uncertainty of a volume flow measurement is not determined solely by the accuracy specification of the anemometer.
Influencing factors include:
- accuracy of the velocity measuring instrument,
- calibration status of the probe,
- determination of duct dimensions,
- number and position of measuring points,
- non-uniformity of the flow profile,
- swirl,
- temporal fluctuations,
- probe alignment,
- reproducibility of positioning,
- distance from flow disturbances.
For the basic relationship:
Q = v̄ · A
the combined relative uncertainty of velocity and area can be approximated by:
u(Q) / Q ≈ √[(u(v̄)/v̄)² + (u(A)/A)²]
However, this approach is only meaningful if the calculated mean value actually represents the cross-section.
An error caused by an unsuitable flow profile or too few measuring points is not automatically included in the instrument accuracy.
Document the measurement reproducibly
Especially for energy audits, system acceptance tests, cleanroom measurements or recurring inspections, more than just the final volume flow should be documented.
At minimum, it is useful to record:
- system or duct designation,
- date and time,
- operating condition of the system,
- fan stage or setpoint,
- damper positions where relevant,
- duct dimensions,
- calculated cross-sectional area,
- position of the measuring plane,
- distance from bends or other disturbances,
- measurement grid used,
- individual velocities,
- mean velocity,
- calculated volume flow,
- measuring instrument and probe,
- calibration status,
- air temperature,
- pressure and humidity where required.
The individual measured values should be retained wherever possible.
Only then can it later be assessed whether not only the mean value but also the flow profile has changed.
Typical error patterns in air volume flow measurements in ducts
| Observation | Possible cause | Recommended check |
|---|---|---|
| Volume flow from center-point measurement significantly higher than expected | Velocity maximum measured in the center of the duct | Perform a grid measurement across the entire cross-section |
| Measured values differ significantly across the cross-section | Non-uniform flow profile | Increase the measurement-grid density and investigate the cause of the disturbance |
| One side of the duct has significantly higher velocities | Bend, damper, branch or asymmetrical inlet | Move the measuring position farther away from the disturbance |
| Measured value changes significantly when the probe is rotated | Swirl or non-axial flow | Check the flow direction and change the measuring plane |
| Repeated measurements show large scatter | Unsteady flow | Increase the measurement duration and form time averages |
| Volume flow is incorrect despite plausible velocities | Incorrect duct cross-section entered | Measure the duct dimensions again |
| Edge areas were not included | Measurement grid only in the center of the duct | Distribute the grid across the entire area |
| Measurement directly downstream of a bend is poorly reproducible | Strongly disturbed profile | Find a straight duct section or increase the measurement-grid density |
| Thermal probe increasingly shows different values | Possible contamination of the sensor element | Inspect the probe and check its calibration status |
| Measured values do not change proportionally after changing the fan stage | System characteristic or control system changes the flow distribution | Perform a complete grid measurement under both operating conditions |
Systematic procedure for duct measurements
The following procedure is recommended for a reliable determination of air volume flow:
- Define the measurement objective: Actual volume flow, standard volume flow, mass flow or system comparison?
- Identify the duct: Ensure that the relevant supply-air or exhaust-air branch is actually being measured.
- Select the measuring point: Use the straightest possible duct section.
- Identify flow disturbances: Document bends, dampers, fans, filters, branches and transitions.
- Evaluate the straight inlet section: Select the greatest possible distance from disturbances.
- Measure the duct dimensions: Do not rely exclusively on design values.
- Calculate the cross-section: Correctly account for rectangular, round or special geometries.
- Select the measuring method: Choose a vane, thermal probe or, where applicable, differential pressure/Pitot method to suit the application.
- Define the measurement grid: Include the entire cross-section, including edge areas.
- Mark the measuring points: Define insertion depths reproducibly.
- Align the probe correctly: Position the sensor according to the flow direction.
- Allow the measured value to stabilize: Do not read the value immediately after inserting the probe.
- Use time averaging for fluctuations: Avoid short single readings.
- Measure all grid points: Do not omit points because they are inconvenient to access.
- Check the velocity profile: Identify extreme local differences.
- Calculate the mean correctly: Use arithmetic or area-weighted averaging depending on the grid.
- Calculate the volume flow:
Q = v̄ · A. - Check the units: Multiply by 3600 for m³/h.
- Apply density only where appropriate: Distinguish between actual volume flow, standard volume flow and mass flow.
- Document the measurement: Record individual values, grid, measuring point and operating condition.
Practical example: single-point measurement overestimates the volume flow
The air volume flow in a rectangular supply-air duct is to be checked.
The duct dimensions are:
800 mm × 500 mm
This gives:
A = 0.8 · 0.5 = 0.40 m²
Step 1: measurement in the center of the duct
The following value is measured in the center of the duct:
v = 5.35 m/s
If this single value were used directly, the result would be:
Q = 5.35 · 0.40 · 3600
Q = 7,704 m³/h
This value initially appears plausible.
Step 2: perform a grid measurement
The duct is then systematically traversed at several measuring points.
The measurement shows:
- central areas are partly above 5 m/s,
- edge areas are significantly lower,
- one side of the duct is slightly faster than the other due to an upstream bend.
All representative measuring points produce:
v̄ = 4.72 m/s
Step 3: calculate the volume flow using the area average
The resulting volume flow is:
Q = 4.72 · 0.40 · 3600
Q ≈ 6,797 m³/h
Step 4: compare the results
| Measurement method | Velocity | Volume flow |
|---|---|---|
| Single-point measurement in duct center | 5.35 m/s | 7,704 m³/h |
| Grid measurement | 4.72 m/s | approx. 6,797 m³/h |
In this example, the single-point measurement would have overestimated the volume flow by more than 13%.
The measuring instrument itself was not faulty.
The error occurred solely because a local velocity was interpreted as the mean duct velocity.
Result: The measurement method is at least as important to the quality of a volume flow measurement as the accuracy of the anemometer used.
Suitable ICS products for air volume flow measurements
testo 416 – 16 mm vane anemometer for duct measurements
The testo 416 is specifically designed for flow and volume flow measurements in ventilation ducts.
The instrument features, among other things:
- 16 mm vane probe,
- wired telescopic probe up to 850 mm,
- flow measuring range from 0.6 to 40 m/s,
- point averaging,
- time averaging,
- automatic volume flow calculation,
- connection to the testo Smart App for storage and documentation.
The combination of a small vane diameter and telescopic probe is particularly practical for grid measurements inside ventilation ducts.
Further information can be found under testo 416 at ICS Schneider.
testo 425 – thermal hot-wire anemometer
The testo 425 uses a thermal flow probe and is also suitable for velocity and volume flow measurements in ventilation ducts.
The instrument offers, among other things:
- thermal hot-wire measuring principle,
- measuring range from 0.01 to 30 m/s,
- telescopic probe up to 820 mm,
- air temperature measurement,
- point averaging,
- time averaging,
- volume flow calculation,
- connection to the testo Smart App.
Due to its high sensitivity at low velocities, the thermal measuring principle is particularly useful for low air velocities.
Further information can be found under testo 425 at ICS Schneider.
testo 440 – flexible air-conditioning measuring instrument with various flow probes
For more comprehensive HVAC, indoor climate and flow measurements, the testo 440 is a flexible measuring system.
Depending on the measurement task, the instrument can be combined with various compatible probes and includes structured measurement menus for volume flow measurement in ducts and at outlets.
Duct geometry and duct dimensions can be entered into the instrument for volume flow calculation.
This makes the testo 440 particularly suitable for users who want to measure additional climate-related parameters alongside flow using a single system.
Further information can be found under testo 440 at ICS Schneider.
Which measuring principle is suitable for which application?
| Measurement task | Recommended solution |
|---|---|
| Typical air velocity in a ventilation duct | 16 mm vane, for example testo 416 |
| Low air velocities | Thermal probe, for example testo 425 |
| Grid measurement across a larger duct | Telescopic probe with point averaging |
| Strongly fluctuating velocity | Time averaging at each grid point |
| Multiple climate and flow parameters | Flexible measuring system such as testo 440 |
| Volume flow directly at the air outlet | Suitable outlet/funnel or vane measurement |
An overview of further measuring instruments and sensors can be found under Flow Measuring Instruments / Flow Sensors at ICS Schneider.
Conclusion
Calculating an air volume flow is mathematically simple:
Q = v̄ · A
The actual measurement challenge, however, is determining a representative mean air velocity.
A single point measurement in the center of the duct is often insufficient in real ventilation systems.
Bends, dampers, filters, branches, fans and other internal components can significantly alter the flow profile. At the same time, due to wall friction, air velocity is not identical everywhere even in a well-developed duct flow.
For reliable results, the cross-section should therefore be measured systematically at multiple points.
Methods such as the Log-Tchebycheff traverse specifically account for the velocity distribution across the duct cross-section.
Equally important are:
- a suitable measuring plane,
- sufficient distance from flow disturbances,
- correct duct dimensions,
- correct probe alignment,
- sufficient measurement duration,
- correct averaging,
- clear documentation of the individual measured values.
It is important not to forget:
The accuracy of the measuring instrument is only one part of the total measurement uncertainty. An unsuitable measurement grid or a poor measuring point can cause a significantly larger error than the instrument deviation itself.
For practical applications, the following procedure therefore applies:
Define the measurement objective → select a suitable measuring plane → determine the duct cross-section → evaluate flow disturbances → define the measurement grid → position the probe correctly → record velocities at all points → calculate the spatial mean → calculate the volume flow → handle the density reference correctly → document individual values and measurement conditions.
FAQ: Determine air volume flow in a ventilation duct from point measurements
How do you calculate the air volume flow in a ventilation duct?
The volume flow is calculated from the mean air velocity and the duct cross-sectional area: Q = v̄ × A. For a result in m³/h, multiply by 3600.
Can I determine the volume flow with a single velocity measurement?
Only if the local velocity actually corresponds to the mean velocity across the cross-section. In real ventilation ducts, this is often not the case. A grid measurement therefore usually provides a more reliable result.
Why is the air velocity often higher in the center of the duct?
Friction at the duct walls slows the flow down near the walls. The velocity in central areas can therefore be higher than the mean across the entire cross-section.
What is a grid measurement in a ventilation duct?
The air velocity is measured at several defined positions across the entire duct cross-section. A representative mean velocity is then calculated from these individual values.
What is the Log-Tchebycheff method?
The Log-Tchebycheff method is a method for arranging measuring points during duct traverses. The points are distributed across the cross-section in such a way that the influence of the velocity drop near the walls is taken into account in particular.
Do the measuring points have to be distributed uniformly?
Not necessarily. In a simple equal-area method, each measuring point represents an equally sized partial area. In the Log-Tchebycheff method, specially calculated measuring-point positions are used instead.
How many measuring points do I need in a ventilation duct?
This depends on the duct geometry, size, flow profile, measurement objective and applicable test procedure. The more disturbed the profile and the greater the required accuracy, the more important it is to use a sufficient number of measuring points.
How do I calculate the mean from the measuring points?
If all points represent equally sized partial areas, the arithmetic mean can be used. If the partial areas differ in size, an area-weighted mean must be calculated.
What is the difference between point averaging and time averaging?
Point averaging combines measured values from different positions across the duct cross-section. Time averaging, on the other hand, averages several measured values over a defined period at the same position.
What should I do if the air velocity fluctuates strongly?
At each grid point, a time average can first be formed over an appropriate period. The time-averaged values are then used to calculate the spatial mean.
How far should the measuring point be from a duct bend?
The greater the distance from bends, dampers and other flow disturbances, the better. For defined tests, the requirements of the applicable measurement standard or test procedure should be followed.
What is the hydraulic diameter?
The hydraulic diameter makes it possible to describe non-circular ducts using a characteristic length. It is calculated using Dh = 4A/P.
Can I measure directly downstream of a bend?
A measurement is generally possible, but the velocity profile may be strongly asymmetrical. A grid measurement and careful assessment of the additional measurement uncertainty are then particularly important.
What does swirl mean in a ventilation duct?
With swirl, the air does not flow exclusively parallel to the duct axis but also has a rotational or lateral velocity component. This can cause direction-sensitive flow probes to produce significantly different measured values.
Which probe is suitable for duct measurements?
Small vane probes or thermal flow probes are frequently used for typical ventilation ducts. The selection depends in particular on the velocity range, duct cross-section, medium and required measurement task.
When is a vane anemometer useful?
Vane anemometers are very well suited to many typical air velocities in HVAC and ventilation ducts and are comparatively robust.
When is a thermal anemometer useful?
Thermal anemometers are particularly useful at low air velocities and often have very small sensor elements that are well suited to measuring velocity profiles.
Why must the probe be aligned correctly?
Many flow probes are direction-sensitive. If the probe is rotated relative to the actual flow direction, the displayed velocity value may deviate.
Do I have to consider air density when calculating volume flow?
For the simple geometric calculation Q = v̄ × A of actual volume flow, no general additional density correction is applied. However, air density becomes relevant, for example, when determining velocity from dynamic pressure and when calculating mass flow or standard volume flow.
How do you calculate mass flow from volume flow?
Using ṁ = ρ × Q. For this, the air density under the respective operating conditions must be known or determined with sufficient accuracy.
Is standard volume flow the same as actual volume flow?
No. Actual volume flow refers to the real conditions inside the duct. A standard or reference volume flow is converted to defined temperature and pressure conditions.
How strongly does an incorrect duct cross-section affect the result?
Directly proportionally. If the area is assumed to be 5% too large, for example, the calculated volume flow will also be approximately 5% too high at an unchanged mean velocity.
Can a more accurate anemometer compensate for a poor measurement grid?
No. A highly accurate instrument only measures the local velocity very accurately. If this local velocity is not representative of the entire cross-section, the calculated volume flow will still be incorrect.
Why should I save the individual measured values?
The individual values show whether the flow profile is uniform or strongly disturbed. During later comparative measurements, this also makes it possible to determine whether only the total volume flow or also the flow distribution has changed.
Which ICS instrument is suitable for grid measurements in a ventilation duct?
The testo 416 with 16 mm vane and telescopic probe is particularly suitable for duct measurements and supports both point and time averaging as well as volume flow calculation.
What alternative is available for low air velocities?
The testo 425 uses a thermal hot-wire probe and covers air velocities from 0.01 m/s. This makes it particularly suitable for applications with lower velocities.
Can I also measure volume flow with the testo 440?
Yes. In combination with a suitable flow probe, the testo 440 provides dedicated measurement menus for volume flow measurements in ducts and can take duct geometry and dimensions into account for the calculation.