


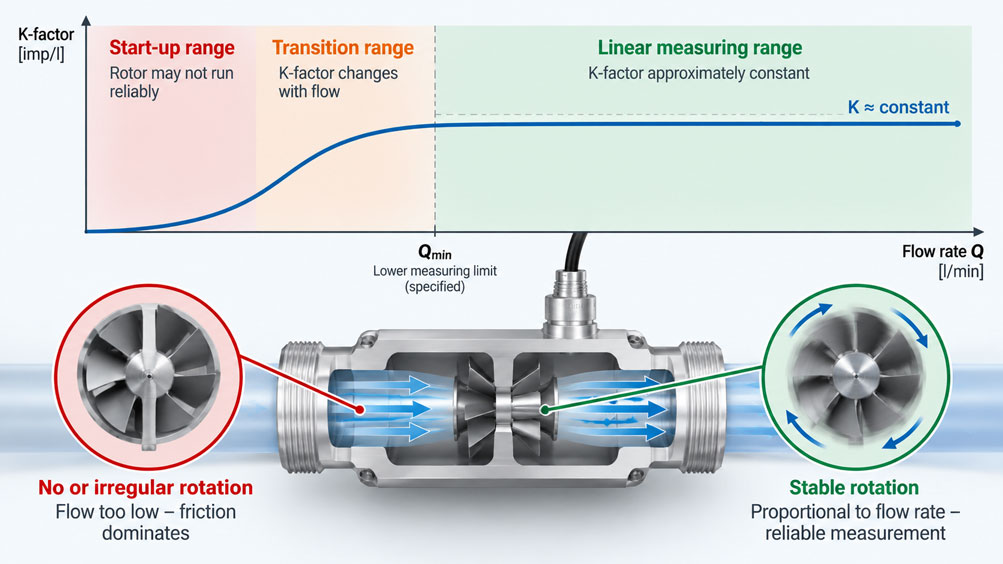
A turbine flow meter can provide highly stable and repeatable flow values in the middle of its measuring range while becoming significantly more sensitive to the medium, temperature and installation conditions near the lower flow limit. This is precisely the range that frequently leads to misinterpretations in test benches, hydraulic systems and cooling circuits.
A typical example is a turbine with a specified flow range of 1 … 20 l/min. At 10 l/min, it operates stably and delivers a clean frequency signal. However, as the volumetric flow is reduced further and further, the balance of forces acting on the rotor changes. The driving torque generated by the medium decreases, while bearing friction and other mechanical resistance do not decrease in the same proportion.
As a result, the rotor may respond more slowly, rotate irregularly or, after coming to a complete standstill, only start reliably again at a somewhat higher flow rate. At the same time, the relationship between rotational speed and volumetric flow can change.
This is where the K-factor becomes important. In the ideal linear range, the turbine flow meter generates approximately the same number of pulses per unit volume passing through it. The K-factor is therefore largely constant in this range. At the lower end of the characteristic curve, however, friction, viscosity and Reynolds number can have a greater influence. The actual K-factor may then differ from the value in the main linear range.
This does not mean that every turbine suddenly comes to a complete stop immediately below its nominal measuring limit. Likewise, visible rotor movement does not automatically mean that the turbine is already measuring within specification.
The lower flow limit stated in a data sheet must therefore be understood as the lower limit of the specified measuring range. It must be distinguished from a purely mechanical start-up or standstill limit.
Electrical signal processing must also be taken into account. At low flow rates, the turbine generates only a small number of pulses per unit time. Even if the mechanical system is still operating correctly, calculation of the instantaneous value becomes slower or coarser. An unstable low-flow reading can therefore have both mechanical and signal-processing causes.
The key point is: The lower measuring range of a turbine flow meter is not determined solely by whether the rotor is still rotating. What matters is whether start-up behavior, K-factor, linearity, viscosity and signal frequency remain within the measurement uncertainty required for the application.
Table of Contents
- How does a turbine flow meter work?
- What does the lower flow limit mean?
- Correctly distinguish start-up flow from the minimum measuring range
- Why rotor friction becomes more important at low flow rates
- What the K-factor actually describes
- Why the K-factor does not have to remain exactly constant over the entire range
- Distinguishing linearity, accuracy and repeatability
- What role does the Reynolds number play?
- Why viscosity and temperature change the lower measuring range
- Why a low number of pulses makes low flow more difficult to evaluate
- Calculating K-factor and frequency using an example
- When multi-point linearization is useful
- Correctly accounting for the flow profile and straight pipe runs
- Why system pressure, air bubbles and cavitation matter
- How contamination and bearing condition affect the lower range first
- Do not oversize the turbine flow meter unnecessarily
- Correctly planning calibration near the lower flow limit
- Systematically diagnosing typical fault patterns
- Suitable turbine flow meters from ICS Schneider
- Conclusion
- Frequently asked questions about the lower flow limit of turbine flow meters
1. How does a turbine flow meter work?
A turbine flow meter determines volumetric flow from the rotational movement of a rotor in the flow channel. The flowing medium exerts a force on the turbine blades and causes the rotor to rotate.
A magnetic, inductive or other suitable signal pickup detects the rotor movement. The passing blades generate a pulse or frequency signal.
Within the intended measuring range, there is an approximately proportional relationship between volumetric flow and rotor frequency. A higher volumetric flow results in a higher rotational speed and therefore a higher output frequency.
The electronics can use this signal to determine both the current volumetric flow and the total volume that has passed through the meter. The frequency is evaluated for the instantaneous value, while the individual pulses are counted for totalized volume.
However, this simple relationship is only sufficiently accurate if the turbine flow meter is operating within its intended hydraulic and mechanical range.
At the lower end of the characteristic curve, this requirement becomes increasingly critical.
2. What does the lower flow limit mean?
If a manufacturer specifies a range of, for example, 1 … 20 l/min for a turbine flow meter, this initially means that the device is specified or calibrated for measurements within this range.
This specification does not necessarily mean that the rotor immediately comes to a complete stop at 0.99 l/min.
A signal may still be generated below the specified limit. However, the stated linearity, accuracy or repeatability no longer automatically applies there.
Conversely, depending on the bearing arrangement, viscosity and operating condition, a rotor that has come to a complete stop may require a certain minimum flow before it begins to rotate reliably again.
The lower measuring range limit is therefore primarily a metrological limit. The mechanical start-up limit is a separate device characteristic.
For system design, it should therefore never be assumed that any visible rotor movement already represents a reliable measured value.
3. Correctly distinguish start-up flow from the minimum measuring range
Start-up behavior describes how the turbine behaves when starting from standstill.
While the rotor is stationary, bearing friction and other resisting torques must first be overcome. Only when the torque generated by the flowing medium is sufficiently high does the rotor begin to rotate.
Once it has started, the rotor may under certain circumstances continue rotating at a slightly lower flow rate. Mechanically, this means that a type of hysteresis between start-up and continued rotation can occur.
For precise flow measurement, however, this mechanical point is not the decisive limit.
The specified lower measuring range limit is the point above which the manufacturer has evaluated or calibrated the measurement performance of the device. It may therefore lie above the purely mechanical start-up limit.
| Term | Meaning | Practical consequence |
|---|---|---|
| Start-up flow | Flow rate at which the stationary rotor reliably begins to rotate | Mechanical characteristic, not automatically the accuracy limit |
| Specified lower measuring value Qmin | Lowest flow rate for which the stated measurement performance applies | Decisive for device selection |
| Range below Qmin | Rotor may still rotate and generate signals | Measured value outside specification |
| Main linear range | K-factor changes only within the permissible linearity deviation | Preferred operating range for precise measurements |
Especially on test benches, a clear distinction should therefore be made between “the turbine is still generating pulses” and “the turbine is still measuring within the required uncertainty”.
4. Why rotor friction becomes more important at low flow rates
The movement of the turbine rotor results from a balance of different forces and torques.
The medium generates a driving torque. Opposing this are, among other things, bearing friction, viscous friction, magnetic or sensor-related influences and hydrodynamic losses.
At medium and high flow rates, the flow-generated torque is sufficiently high that these loss torques have only a small relative influence.
As the flow rate decreases, the driving torque decreases. The mechanical losses therefore become increasingly significant in relative terms.
The rotor then no longer rotates as ideally proportional to the volumetric flow as it does in the main measuring range.
For many turbines, this can result in a tendency toward under-reading because the rotor rotates more slowly than would correspond to the ideal linear characteristic. However, the exact shape of the characteristic curve depends on the specific turbine design, medium and calibration condition and should not be assumed universally.
For a reliable assessment, the actual calibration curve is therefore more meaningful than a purely theoretical assumption about turbine behavior.
5. What the K-factor actually describes
The K-factor describes the relationship between the generated pulses and the volume that has passed through the meter.
If, for example, the K-factor is specified in pulses per liter, a value of 1,000 pulses/l means that 1,000 detected pulses correspond to a total volume of one liter.
For the total volume:
V = N / K
where V is the volume, N is the number of counted pulses and K is the K-factor.
For instantaneous flow, the signal frequency can be used. If Q is expressed in liters per second, the ideal relationship is:
f = K · Q
or:
Q = f / K
If the flow rate is required in liters per minute, the corresponding time factor must be included:
Q [l/min] = 60 · f [Hz] / K [pulses/l]
These equations are simple. However, their accuracy depends on whether the K-factor being used is valid at the actual operating point.
6. Why the K-factor does not have to remain exactly constant over the entire range
In an ideal model, the K-factor of a turbine flow meter would remain exactly constant over the entire measuring range.
In reality, the turbine has a calibration characteristic.
In a well-designed main measuring range, this characteristic forms a comparatively flat plateau: Changes in flow rate cause only minor changes in the K-factor.
Near the lower measuring limit, however, mechanical losses and fluid-dynamic effects can become more significant. The local K-factor then begins to change more strongly with flow rate.
This change is a major cause of increasing non-linearity in the lower range.
For simple applications, a single calibrated K-factor is often sufficient. Where higher accuracy is required, a multi-point calibration can capture the actual characteristic curve and the evaluation electronics can store different K-factors for different flow ranges.
However, such linearization cannot arbitrarily extend the physical limits of the turbine. If the rotor no longer rotates reproducibly, software cannot replace the missing mechanical measurement information.
7. Distinguishing linearity, accuracy and repeatability
The terms linearity, accuracy and repeatability are frequently confused when discussing turbine flow meters.
Linearity describes how much the actual characteristic deviates from the selected ideal or averaged relationship between flow rate and output signal.
Repeatability, by contrast, describes how similar the results are when the same operating point is approached repeatedly under identical conditions.
A turbine can therefore have very good repeatability while still exhibiting a systematic error at low flow. It may repeatedly produce almost exactly the same value – but that value can still differ from the true reference value.
Total measurement uncertainty also includes additional influences such as calibration, temperature, viscosity, installation, reference measurement and signal processing.
| Characteristic | What is evaluated? | Typical significance at the lower measuring range |
|---|---|---|
| Linearity | Deviation of the characteristic curve from the ideal proportional relationship | Can deteriorate due to a changing K-factor |
| Repeatability | Scatter when repeatedly approaching the same operating point | Can remain good even when a systematic error is present |
| Measurement deviation | Difference between indicated value and reference value | Can become significantly more sensitive to medium and installation conditions at Qmin |
| Measurement uncertainty | Total uncertainty from device, calibration and application | Must be evaluated for the actual operating point |
For practical applications, this means that a stable low reading is not proof that the turbine is measuring accurately at that point.
8. What role does the Reynolds number play?
The behavior of a turbine flow meter is determined not only by the volumetric flow itself, but also by the flow regime.
An important parameter is the Reynolds number. In simplified terms, it depends on flow velocity, a characteristic dimension and kinematic viscosity.
As the flow rate decreases, the flow velocity also decreases. If viscosity increases at the same time, the Reynolds number falls even further.
This changes the relationship between inertial and viscous forces within the medium.
At the same volumetric flow, the turbine can therefore behave differently with a low-viscosity warm oil than with a significantly more viscous cold oil.
This influence is particularly relevant near the lower flow limit because mechanical and viscous losses already represent a larger proportion of the overall force balance there.
The statement “5 l/min is 5 l/min” is therefore only metrologically complete if the medium properties relevant to the turbine are also taken into account.
9. Why viscosity and temperature change the lower measuring range
For liquids such as hydraulic oil, viscosity can change significantly with temperature.
Cold hydraulic oil can be many times more viscous than the same oil at normal operating temperature.
For the turbine flow meter, this means greater viscous resistance and a changed Reynolds number. The K-factor can therefore change more significantly, especially at the lower end of the measuring range.
This is precisely why the calibration viscosity of a turbine flow sensor is an important technical parameter.
Depending on the version, the current HySense QT5xx series is designed for a viscosity range of 1 … 150 cSt. For the aluminum version, the standard calibration viscosity is 30 cSt, while different calibration conditions are specified for certain stainless-steel versions.
Hydrotechnik explicitly points out that deviation from the calibration viscosity can significantly impair measurement accuracy.
For applications with strongly varying oil temperature, viscosity compensation can therefore be useful. With the HySense QT600, Hydrotechnik combines a special calibration with temperature- or viscosity-dependent correction.
10. Why a low number of pulses makes low flow more difficult to evaluate
Even if the turbine is mechanically operating correctly, electrical evaluation becomes more demanding at low frequency.
A pulse output provides individual events. The lower the flow rate, the longer the time interval between two pulses.
This results in two practical effects.
First, time resolution decreases. Electronics that count the number of pulses within a fixed time window receive only a small number of events at low frequency. The displayed value can therefore change in larger increments.
Second, a longer averaging period is often required to obtain a stable reading. This improves display stability but slows the visible response to actual flow changes.
Alternatively, the electronics can measure the time between two pulses. This method also has limitations if the signal becomes irregular or individual interference pulses occur.
An unstable low-flow reading does not therefore necessarily indicate a defective rotor. Mechanical operation below the intended range and low signal frequency should be investigated separately.
11. Calculating K-factor and frequency using an example
A simplified example illustrates the influence of signal frequency.
Assume that a turbine has a K-factor of 1,000 pulses per liter. This value is used solely for illustration and is not the K-factor of a specific ICS product.
At 6 l/min, the volumetric flow is 0.1 l/s. The signal frequency is therefore:
f = 1,000 pulses/l · 0.1 l/s = 100 Hz.
At only 0.6 l/min, by contrast, the frequency is:
10 Hz.
At 0.06 l/min, it would be only:
1 Hz.
The electronics then receive only one pulse per second. A fast and at the same time stable instantaneous-value indication inevitably becomes more difficult.
This example also demonstrates why the electrical usable range of a turbine signal should be considered together with the hydraulic measuring range.
12. When multi-point linearization is useful
With simple single-point evaluation, one K-factor is used for the entire measuring range.
This is appropriate when the actual K-factor characteristic is sufficiently flat over the relevant range and the required measurement uncertainty is maintained.
For higher accuracy requirements, the turbine can be calibrated at several flow points.
The individual points create a K-factor characteristic. The evaluation electronics can then use the appropriate correction value depending on the current frequency or flow range.
This allows non-linearity to be reduced within the reproducible operating range.
This is particularly useful when a test bench must cover a wide flow range and the lower operating points are also relevant.
However, the calibration points must be recorded under representative conditions. Multi-point linearization using a low-viscosity calibration medium cannot automatically eliminate the viscosity dependence of a completely different process medium.
13. Correctly accounting for the flow profile and straight pipe runs
A turbine flow meter responds to the flow that actually reaches its rotor.
Elbows, valves, abrupt changes in cross-section, pumps and other components can generate swirl or asymmetric velocity profiles. The rotor is then exposed to a different flow profile from the one present during calibration.
In the middle of the measuring range, such a disturbance can already cause a systematic error. At the lower end, it can additionally influence stable start-up and rotational behavior.
The required upstream and downstream straight pipe runs should therefore be taken from the manufacturer’s specifications for the specific sensor.
For the current Hydrotechnik QT5xx and QT600, for example, straight upstream runs of 30 × nominal diameter before the turbine and 10 × nominal diameter after the turbine are recommended. These values are product-specific and should not be applied to every turbine flow meter without verification.
Severe changes in cross-section immediately upstream of the sensor should also be avoided.
14. Why system pressure, air bubbles and cavitation matter
Volumetric flow alone does not describe all operating conditions of a turbine flow meter.
For liquids, the medium must flow around the rotor completely and continuously. Air bubbles change the local flow conditions and can make the turbine signal unstable.
Very low static pressure can also promote degassing or cavitation. In that case, a homogeneous liquid no longer flows exclusively through the sensor.
For the QT5xx and QT600, Hydrotechnik explicitly requires that no air bubbles be present in the hydraulic system. In addition, a relative system pressure of at least 1 bar should be present at the turbine outlet.
This requirement demonstrates that a turbine must not be selected based solely on its flow range. The complete hydraulic condition of the measuring point is part of the specification.
Especially near Qmin, entrained air and unstable flow conditions can additionally interfere with an already low rotor-driving torque.
15. How contamination and bearing condition affect the lower range first
A small increase in bearing friction may have only a minor relative influence at high flow rates.
Near the lower measuring limit, the situation is different.
There, even a small deposit, a particle in the bearing area or increased mechanical resistance can absorb a significant proportion of the available driving torque.
Beginning wear therefore often becomes apparent first as poorer start-up behavior or a changed lower characteristic curve.
The turbine may still appear to measure normally at higher flow rates, while low values increasingly under-read or only appear after a delay following standstill.
Such an effect should not immediately be “calibrated away” using a new K-factor.
It must first be determined whether the mechanical characteristics of the sensor have changed.
16. Do not oversize the turbine flow meter unnecessarily
When selecting the device, the maximum possible volumetric flow is not the only important parameter.
If an application operates between 2 and 15 l/min, a very large turbine flow meter with a range extending to several hundred liters per minute might be hydraulically capable of handling the flow but would be a poor choice from a metrological perspective.
Normal operation would continuously take place at the lower edge of or even below the specified range.
A smaller size makes better use of the linear range and, at the same process flow, generally produces a rotor speed or signal frequency better suited to that meter size.
The current QT5xx family illustrates this principle clearly. Depending on connection and size, available ranges include 1 … 20, 2 … 75, 5 … 150, 9 … 300 and 16 … 600 l/min.
An expected normal flow should therefore not simply lie “somewhere within the data-sheet range”. In particular, the lowest continuously relevant process value should remain sufficiently within the specified range.
If the process varies over several orders of magnitude on a regular basis, it may also be reasonable to ask whether a single turbine flow meter is the appropriate measurement principle at all.
17. Correctly planning calibration near the lower flow limit
If the low-flow range is particularly important for an application, this range should also be adequately represented during calibration.
A calibration performed only at medium and high flow rates provides limited information about how the K-factor behaves immediately above Qmin.
For multi-point calibration, operating points should therefore be selected that represent the range actually used in the application.
The medium and temperature are equally important.
For turbine flow meters used with oil, a calibration performed at a strongly different viscosity can transfer much less accurately to the actual installation, particularly in the lower range.
If the turbine is later operated with varying oil temperature, it should therefore either be calibrated under representative conditions or use a viscosity compensation specifically intended for this purpose.
The calibration certificate should also not be regarded merely as a source of one single K-factor. For demanding applications, the shape of the characteristic across the individual calibration points is the more important information.
18. Systematically diagnosing typical fault patterns
| Observation | Possible cause | Recommended check |
|---|---|---|
| Turbine only shows a reading above a certain flow rate | Start-up torque is insufficient below this point or signal detection starts too late | Check rotor condition, bearings, signal pickup and reference flow together |
| Low flow rates are indicated too low | Friction or changing K-factor in the lower range | Check multi-point calibration and viscosity |
| Measurement becomes significantly worse with cold oil | Higher viscosity and lower Reynolds number | Compare oil temperature, viscosity and calibration conditions |
| Low-flow reading fluctuates strongly | Very low pulse frequency or unstable rotor movement | Examine raw frequency or pulse interval |
| Turbine continues running at lower Q after previously operating at a higher flow | Possible mechanical start-up/run-down hysteresis | Repeat the measurement both from standstill and from a higher flow rate |
| K-factor is correct in the middle range but not at Qmin | Non-linear characteristic curve | Use multi-point K-factors or linearization |
| After extended operation, Qmin performance deteriorates first | Increased bearing friction, contamination or deposits | Inspect the turbine mechanically instead of only rescaling it |
| Measurement fluctuates despite a constant setpoint | Air bubbles, swirl, pulsating flow or unstable installation conditions | Check venting, system pressure and upstream straight run |
19. Suitable turbine flow meters from ICS Schneider
ICS Schneider Messtechnik offers turbine flow sensors for hydraulics, test benches and industrial volumetric flow measurement. An overview can be found under Turbine Flow Meters.
HySense QT5xx
The HySense QT5xx turbine flow sensor is designed for stationary and mobile flow measurements as well as test and diagnostic applications.
Different flow ranges are available depending on the size. These include, among others, 1 … 20, 2 … 75, 5 … 150, 9 … 300 and 16 … 600 l/min.
This range differentiation is particularly relevant to the subject of the lower flow limit: The meter size should be selected so that the actually important operating range lies as well as possible within the intended sensor characteristic.
The QT5xx family has a response time of less than 0.05 s and, depending on the version, is available with frequency, 4-20 mA or CAN output.
Hydrotechnik specifies a viscosity range of 1 … 150 cSt for the product family and points out that deviations from the calibration viscosity can significantly influence measurement accuracy.
For reproducible installation, Hydrotechnik also recommends a straight upstream run of 30 × nominal diameter and a downstream run of 10 × nominal diameter for this series.
HySense QT600 with viscosity compensation
The HySense QT600 was specifically developed for applications in which the viscosity of the hydraulic medium varies significantly with temperature.
The specified flow range is 9 … 300 l/min. Viscosity compensation covers 5 … 100 cSt.
At the standard calibration viscosity of 30 cSt, Hydrotechnik specifies an error limit of ±0.5% of reading. Across the compensated viscosity range, an error limit of ±2.5% of reading is specified.
For this purpose, the sensor combines a special turbine calibration with an algorithm that accounts for the current viscosity either from user input or from temperature and a stored oil characteristic.
This principle is particularly useful in the lower range because viscosity can have an especially pronounced influence there.
Further turbine versions
The current Turbine Flow Meters category also includes HySense QT3xx, QT4xx “Heavy Duty” and QL2xx versions for different connection, flow and test-bench requirements.
The appropriate size should not be selected solely on the basis of maximum flow. Important design parameters include the minimum continuous operating point, maximum flow, medium, viscosity, temperature, system pressure, desired output signal and required measurement uncertainty.
Further technical articles
The electrical evaluation of frequency and pulse count is covered in detail in our article “Pulse and Frequency Output of Turbine Flow Meters: Correctly Evaluating Flow”.
Installation errors, air bubbles, K-factor and general troubleshooting are covered in the article “Turbine Flow Meter Shows Incorrect Values: Causes Related to Installation, Medium and Calibration”.
For hydraulic oils and their temperature-dependent viscosity, the article “Turbine Flow Meters for Hydraulic Oil: What to Consider Regarding Pressure, Viscosity and Temperature” is also relevant.
20. Conclusion
The lower flow limit of a turbine flow meter is more than simply the point at which the turbine rotor is barely still moving.
At low volumetric flow rates, the driving flow torque decreases while bearing friction and other mechanical losses become relatively more significant. At the same time, Reynolds number and viscous influences change.
As a result, the K-factor can change more strongly with flow rate. The characteristic increasingly departs from the largely linear range on which the simple conversion between frequency and volumetric flow is based.
The mechanical start-up limit must therefore be distinguished from the specified lower measuring range limit. A rotor can continue rotating below Qmin without the stated measurement performance still being met.
At the same time, signal frequency decreases with flow. A small number of pulses per unit time reduces time resolution and may require stronger averaging.
For oil applications in particular, temperature must also be considered. Higher viscosity can influence the lower range much more strongly than an operating point in the middle of the measuring range.
For reliable system design, the following sequence therefore applies:
Determine the actual minimum flow → consider medium and viscosity → select the appropriate turbine size → remain above the specified Qmin → ensure correct installation conditions → check K-factor and calibration curve → evaluate signal frequency and signal processing.
The most important practical selection rule is therefore: A turbine flow meter should not be selected so large that the normal process regularly operates immediately at its lower flow limit.
If the relevant operating point lies permanently in a range where start-up behavior, K-factor and linearity are already sensitive, either a smaller turbine or a different flow-measurement principle is the better solution.
21. Frequently asked questions about the lower flow limit of turbine flow meters
What does the lower flow limit of a turbine flow meter mean?
It defines the lowest flow rate above which the manufacturer specifies the corresponding measurement performance of the sensor. Below this limit, a signal may still be present without accuracy and linearity remaining guaranteed.
Is minimum flow the same as start-up flow?
Not necessarily. Start-up flow describes the mechanical point at which a stationary rotor reliably begins to move. The specified minimum flow is a metrological limit.
Can a turbine flow meter still generate pulses below its specified measuring range?
Yes, this is possible. However, these pulses do not automatically mean that a flow value within specification can still be calculated from them.
Why does a turbine flow meter often measure less accurately at very low flow?
Because the torque generated by the medium becomes smaller while bearing friction and viscous losses become relatively more significant. The K-factor can also change more strongly.
What is the K-factor?
The K-factor indicates how many pulses a turbine generates per unit volume, for example pulses per liter. It forms the basis for converting the frequency or pulse signal into flow and total volume.
Is the K-factor always constant?
Ideally, it would be constant. Real turbine flow meters, however, have a calibration characteristic. Within the main linear range, the K-factor changes only slightly; particularly near the lower measuring range, deviations can become larger.
What is a multi-point K-factor?
Different calibrated K-factors are stored for different flow ranges. The evaluation electronics can use these values to linearize the actual characteristic more accurately.
Can multi-point linearization extend the measuring range downward indefinitely?
No. It can correct reproducible non-linearity, but it cannot compensate for unstable rotor movement or insufficient start-up torque.
What does linearity mean for a turbine flow meter?
Linearity describes how strongly the actual relationship between flow and output signal or K-factor deviates from the idealized characteristic.
Is repeatability the same as accuracy?
No. A turbine can indicate the same incorrect value very reproducibly. Good repeatability therefore does not automatically mean low measurement deviation.
Why does viscosity affect the lower measuring range?
Higher viscosity increases flow- and friction-related resistance and changes the Reynolds number. This influence is particularly relevant when rotor-driving torque is low.
Why does temperature affect hydraulic-oil measurement?
The viscosity of hydraulic oil is strongly temperature-dependent. Cold oil can be significantly more viscous than warm oil and can therefore alter the turbine characteristic.
What does the Reynolds number have to do with a turbine flow meter?
It describes the relationship between inertial and viscous forces in the flow. Changes in flow rate, viscosity and geometry alter the Reynolds number and therefore the flow conditions at the rotor.
Why does the reading become more erratic at low flow?
The frequency output then generates only a small number of pulses per unit time. This reduces the time resolution of the measurement and may require a longer averaging period.
Can stronger filtering make low-flow measurement more accurate?
A longer averaging period can make the display more stable, but it does not eliminate mechanical non-linearity or an incorrect K-factor. It mainly improves signal presentation.
Why must a turbine flow meter be properly vented?
Air bubbles alter the flow conditions at the rotor and can produce an unstable or incorrect frequency signal. With liquid turbine meters, a completely filled measuring cross-section should therefore be ensured.
Why are straight upstream pipe runs important?
Disturbances such as swirl or asymmetric velocity profiles alter the way the flow approaches the rotor. This can shift the relationship between flow rate and rotor frequency.
Should the normal operating point be directly at Qmin?
This should be avoided where possible. Even small changes in viscosity, temperature, installation conditions or mechanical condition could otherwise move operation outside the specified range.
How do I select the correct turbine size?
Not only the maximum flow but also the minimum regularly occurring flow is decisive. The relevant operating range should lie as well as possible within the specified measuring range of the selected size.
When should I use another measuring principle instead of a turbine flow meter?
If permanently very low flow rates, strongly varying or high viscosities, contaminated media, an extremely wide measuring range or measurement without moving parts are required, other principles such as oval gear, gear, Coriolis, electromagnetic or other flow-measurement technologies may be more suitable.
What information does ICS Schneider require to select a turbine flow meter?
Useful information includes minimum, normal and maximum volumetric flow, medium, viscosity at minimum and maximum temperature, operating pressure, available process connection, required measurement accuracy, installation conditions, flow direction, required dynamic response and the desired output signal such as frequency, 4-20 mA or CAN.