


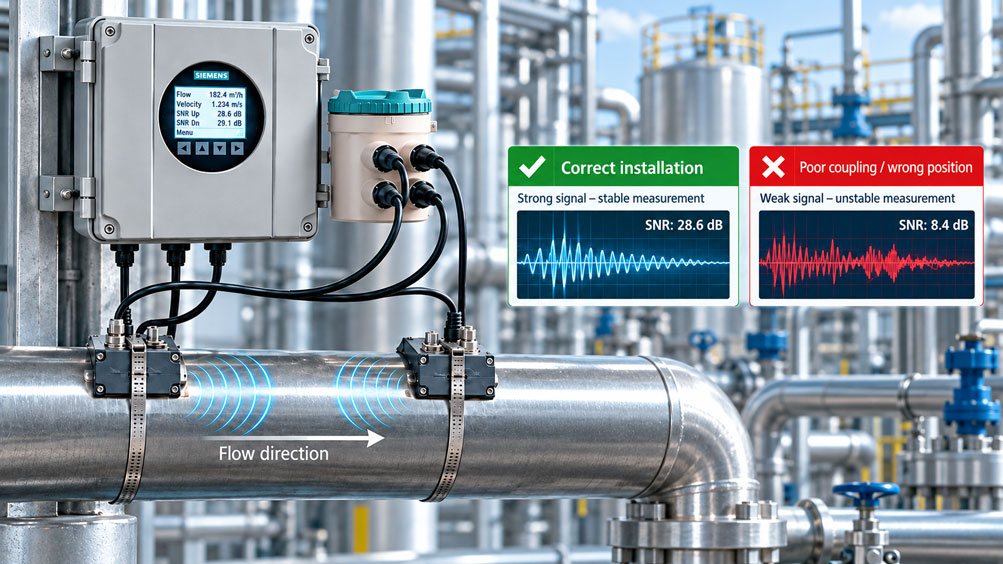
A SITRANS clamp-on ultrasonic flowmeter has been installed and is displaying a plausible flow value. The sensors are mounted externally on the pipe, the entered pipe diameter is correct and the system is operating steadily. At first glance, commissioning therefore appears to be complete.
With a clamp-on measurement, however, it is worth taking a closer look. Unlike a measuring device installed directly in the medium, the ultrasonic signal must first travel from the sensor through the coupling material, pipe wall and medium, then reach the opposite side of the pipe or the defined acoustic path, and finally be received reliably again.
A measurement can therefore already display an apparently plausible flow value even though the acoustic conditions are not yet optimal. A small installation error, an unfavourable coupling point or inaccurate pipe data do not necessarily cause an immediate complete loss of signal. Initially, they may simply reduce the available signal margin.
This is precisely where the diagnostic values of the SITRANS system are useful. In addition to the actual flow value, parameters such as signal-to-noise ratio, required receive gain, sound velocity, upstream and downstream transit time and transit-time difference can be evaluated. Depending on the transmitter, additional values such as peak amplitude, signal correlation and the proportion of accepted signal bursts are also available.
These values should not be assessed individually as simply “good” or “bad”. Together, they provide a picture of how reliably the acoustic measurement path is operating.
The most important rule is therefore: With a SITRANS clamp-on measurement, installation quality should not be assessed solely on the basis of the displayed flow value. Signal quality, receive gain, transit time, sound velocity and the stability of the diagnostic values provide additional information about whether sensor position, coupling point and entered pipe data actually match.
How does SITRANS clamp-on ultrasonic measurement work?
With clamp-on ultrasonic measurement, the sensors are mounted externally on the pipeline. The pipe does not need to be opened and the sensors do not come into contact with the medium.
For flow measurement, the system uses the transit-time difference principle. Two ultrasonic signals are transmitted along a defined acoustic path through the pipe wall and the medium. One signal travels in the direction of flow and the other against the direction of flow.
When flow is present, the signal travelling with the flow takes slightly less time to reach the receiver than the signal travelling against the flow. This very small time difference is evaluated and used to determine the flow velocity.
The absolute transit time is considerably greater than the actual transit-time difference. The system must therefore not only detect an ultrasonic signal, but also determine its exact timing with very high precision.
The quality of the measurement therefore depends directly on the quality of the received signal. If the acoustic coupling is poor, strong interference occurs or the entered pipe parameters do not match the actual geometry, determining the transit times becomes more difficult.
The diagnostic values reveal exactly this situation well before a complete measurement failure occurs.
Which diagnostic values are particularly useful for installation verification?
SITRANS FST020 and FST030 provide several diagnostic parameters describing the acoustic measurement path. Not every value has the same function.
For installation verification, the received-signal quality and timing values are particularly useful. The signal-to-noise ratio describes how clearly the useful signal stands out from the electrical or acoustic background. RXGain indicates how much the receive electronics need to amplify the incoming signal. Travel Time Up and Travel Time Down, on the other hand, show when the respective ultrasonic signals reach the receiver.
Additional parameters include the calculated sound velocity of the medium and the Delta Time between the two directions. Certain instrument versions also allow peak amplitude, signal correlation factor and other internal diagnostic values to be evaluated.
| Diagnostic value | What does it describe? | Typical significance for installation verification |
|---|---|---|
| SNR Up / Down | Signal-to-noise ratio of the received ultrasonic signals | Indicates signal quality relative to background noise |
| RXGain Up / Down | Required receive amplification | High required amplification can indicate a weaker received signal |
| Peak Amplitude | Peak amplitude of the received signal | Provides additional information about received signal level |
| Correlation Factor | Quality of signal matching or signal detection | Helpful for assessing stable signal detection |
| Travel Time Up / Down | Absolute transit time of the ultrasonic signals | Plausibility check for acoustic path, geometry and sensor position |
| Delta Time | Difference between the two transit times | Basis for flow calculation |
| Sound Velocity | Calculated sound velocity of the medium | Plausibility check for the medium and configured application |
None of these values should be used on its own as an acceptance criterion. Their combination is what matters.
Correctly interpreting SNR
SNR stands for Signal-to-Noise Ratio. In simplified terms, this value describes how clearly the received ultrasonic signal is distinguishable from the existing noise level.
A high signal-to-noise ratio means that the receiver can clearly distinguish the useful signal from the background. If the SNR drops significantly, the measurement becomes more susceptible to acoustic and electrical interference.
With a newly installed clamp-on measuring point, SNR is therefore a good indicator of whether the sensors actually have a usable acoustic connection to the pipe.
However, a low value does not automatically mean that the sensor has been installed incorrectly. Difficult pipe materials, strong attenuation through the pipe wall, gas bubbles, solids in the medium or unfavourable process conditions can also reduce signal quality.
For this reason, comparison before and after a deliberate installation change is particularly useful.
If, for example, a sensor is recoupled and the SNR subsequently increases significantly while the process remains unchanged, this indicates that the acoustic coupling has improved.
An absolute individual value is less informative than a reproducible improvement under identical process conditions.
RXGain: why less amplification is often better
RXGain describes the amplification required by the receive amplifier to evaluate the incoming ultrasonic signal.
A strong received signal requires less electronic amplification. A weak signal must be amplified more strongly.
As a basic interpretation rule, therefore: A lower RXGain value generally indicates a stronger received signal.
This is very practical for installation verification. Assume that after initial installation the system requires relatively high receive gain. After cleaning the pipe surface, reapplying the coupling medium and carefully pressing the sensor against the pipe, RXGain decreases significantly.
This provides an objective indication that the acoustic connection has improved.
Here too, however, caution is required when using general threshold values. The required gain depends on factors such as pipe size, material, wall thickness, sensor design, signal path and medium.
On a large, thick-walled pipe, higher required amplification may be completely normal, while the same value on a small steel pipe could indicate poor coupling.
For practical applications, comparison between upstream and downstream as well as comparison before and after an installation change is therefore particularly valuable.
Assessing peak amplitude and signal correlation
The FST020 also provides diagnostic values for the peak amplitude of the received signals and the signal correlation factor.
These values complement SNR and RXGain. Peak amplitude describes the signal level in the receive path, while correlation provides information about how clearly and reproducibly the system identifies the relevant ultrasonic signal.
A single large amplitude does not automatically mean that the measuring point is optimal. A strong signal can, for example, also be accompanied by interference or unwanted reflections.
Conversely, a somewhat weaker but very clean and stably correlated signal may be more suitable for transit-time measurement.
Installation should therefore not be optimised simply to maximise one individual diagnostic value.
The objective is a stable acoustic path in which the upstream and downstream signals are reliably detected and the resulting transit times remain reproducible.
Understanding Up and Down transit times
The absolute transit times indicate how long the ultrasonic signal requires for the respective acoustic path.
During an operating process, the two values differ slightly. The signal travelling with the flow reaches the receiver faster than the signal travelling against the flow.
The absolute transit time is determined primarily by the geometry of the measurement path and the sound velocities in the materials through which the signal passes.
These include in particular the pipe diameter, wall thickness, pipe material, sensor arrangement and medium.
This makes transit time an interesting plausibility parameter for installation verification.
If, for example, the actual pipe wall is considerably thicker than the value entered in the configuration, the calculated acoustic path does not exactly match the real measuring point. The same applies if the outside diameter is incorrect or an unsuitable pipe material has been selected.
Under certain circumstances, the system may still find a signal. However, the diagnostic values then indicate that the real acoustic conditions do not optimally match the stored application data.
What does Delta Time indicate?
Delta Time is the precisely measured difference between the upstream and downstream transit times.
This difference is considerably smaller than the absolute transit times and forms an essential basis for calculating the flow.
At zero flow, the transit times in both directions should be almost identical. Delta Time therefore moves towards zero, although real systems always have a certain measurement scatter and zero-point characteristic.
As flow increases, the time difference between the two directions increases.
For installation verification, it is particularly useful to check whether Delta Time is stable and plausible for the process.
A strongly fluctuating Delta Time during an otherwise constant flow can indicate that signal detection is not sufficiently stable. Possible causes include a poor coupling point, gas bubbles in the medium, a problematic pipe wall or unfavourable sensor positions.
Delta Time should therefore not be considered as the sole installation value. Together with SNR, RXGain and the transit times, however, it provides very useful information about whether the measurement path is operating stably.
Using sound velocity as a plausibility check
The SITRANS system also determines or processes the sound velocity of the medium.
This value is particularly interesting for diagnostics because it provides a physical connection between the measured acoustic path and the expected medium.
A clearly implausible sound velocity should therefore not simply be ignored as a secondary diagnostic value.
It may indicate, for example, that pipe parameters, medium data or sensor arrangement do not match the actual application. A different process state from the one assumed can also be the cause.
The sound velocity of a medium depends, among other things, on the medium itself, temperature, pressure and composition. For this reason, an arbitrary table value should not be treated as an absolute target value.
The sensible approach is to compare the measured value with a range that is plausible for the actual process condition.
This check can be particularly useful in known water applications. With hydrocarbons, gases or changing mixtures, however, the assessment must be adapted more closely to the specific application.
Detecting incorrect sensor spacing using diagnostic values
In a clamp-on measurement, the spacing between the sensors is derived from the pipe geometry, sensor type and selected acoustic configuration.
An installation error of a few millimetres does not necessarily result in an immediate complete loss of signal. The sensors may still receive an ultrasonic signal even though they are not positioned exactly at the optimum locations.
This creates a typical situation in which the flow value initially appears plausible but the diagnostic values show little reserve.
If the sensor spacing is subsequently corrected, SNR and RXGain may improve significantly and the transit times may become more stable.
This is precisely why the calculated or specified installation position should not simply be transferred approximately using a tape measure. The actual sensor position is part of the quality of the measuring point.
During maintenance work, it is equally important to restore the original position reproducibly.
Diagnosing the coupling point and pipe wall
There must be no significant air gap between the clamp-on sensor and the pipe wall. Air has completely different acoustic properties from the intended coupling materials and can drastically reduce energy transmission.
For this reason, the contact surface, pipe condition and coupling medium are carefully prepared during installation.
Rust, loose coatings, severe surface irregularities or unsuitable paint layers can affect acoustic transmission. The sensor can be mechanically secure while still being acoustically poorly coupled.
SNR and RXGain are particularly useful for assessing this condition.
If the sensors are installed on a neighbouring, better-prepared section of the same pipe and the signal quality improves significantly, the original coupling point is likely to have been the cause.
This method is particularly valuable because there is no need to immediately assume that the entire measuring instrument or sensor is defective.
The diagnostic values allow an electronic device fault to be distinguished from a local installation problem.
Why incorrect pipe data can cause problems despite a good signal
Strong signal quality does not automatically mean that the flow value is correct.
An ultrasonic signal can travel extremely well through a pipeline even though an incorrect wall thickness or internal diameter has been entered in the instrument.
This is an especially important distinction.
Signal quality answers the question of whether the acoustic signal is transmitted reliably. The configuration additionally determines whether the correct flow value is calculated from that signal.
If the pipe diameter is incorrect, for example, the calculated cross-sectional area may also be incorrect. The resulting volumetric flow is then systematically offset even though SNR and RXGain look excellent.
Incorrect wall thickness or an incorrect pipe material also changes the calculation of the acoustic path and can influence the optimum sensor position.
Diagnostic values and plausibility checking of the entered pipe data therefore always belong together.
Diagnostics at standstill and zero flow
A particularly useful condition for commissioning is a safely verified process standstill with actual zero flow.
Under these conditions, the upstream and downstream transit times should be almost identical. This makes it possible to assess whether an unusual flow value is actually caused by the process or whether a systematic difference is already present without flow.
However, a zero-flow check does not replace signal-quality verification.
Even a poorly coupled sensor may coincidentally show a value close to zero at standstill. The decisive question is whether the diagnostic values are simultaneously stable and provide sufficient signal margin.
Conversely, a very good signal during an assumed standstill may reveal a small real flow that was not initially expected from the process.
Zero-point evaluation should therefore only be carried out when the actual hydraulic condition is reliably known.
Comparing upstream and downstream values
A major advantage of the diagnostics is that many signal parameters are available separately for the two directions.
This makes it possible to determine whether both signal paths are operating with similar quality.
If, for example, SNR Up is significantly better than SNR Down or the downstream path requires much higher receive amplification, it should be investigated why the two directions behave so differently.
A certain difference does not automatically indicate a fault. Flow, pipe geometry and process conditions can affect the signals differently.
However, an extreme or suddenly occurring asymmetry is diagnostically interesting.
It may indicate, among other things, changed coupling at one sensor, a mechanical positioning error or a process change.
Especially during maintenance and long-term condition monitoring, it is therefore not only the absolute SNR value that matters, but also the symmetry and temporal development between upstream and downstream.
Trends are often more important than individual values
A diagnostic value becomes much more meaningful when a reference value is available.
If it was documented during commissioning that a measurement path had, for example, a high and stable SNR and a certain receive gain, later changes can be identified more easily.
If the signal margin gradually decreases over several months while the process and configuration remain unchanged, this can indicate a change in the coupling point or pipe wall.
If RXGain suddenly increases significantly after maintenance work, on the other hand, this suggests that the sensor position or coupling may have changed.
Transit time and sound velocity can also be useful as trend values. With a constant medium and process, these values should not change abruptly without a cause.
Diagnostics thereby develop from a one-time troubleshooting tool into a method for monitoring the condition of the measuring point.
Practical example: plausible flow, but installation still not optimal
A SITRANS clamp-on system is retrofitted to a cooling-water pipeline. According to the plant documentation, the process flow is normally approximately 180 m³/h.
After initial commissioning, the instrument displays 175 m³/h. The value appears plausible and is close to the expected operating point.
However, when the diagnostic values are checked, it is found that the receive electronics require relatively high amplification and that the signal-to-noise ratio is significantly worse than expected.
The sensors are inspected again. One of the two sensors is positioned on a section of pipe with an older, uneven coating. Mechanically, the mounting is secure, but the acoustic contact surface is not optimal.
The measuring point is re-prepared in accordance with the permitted installation instructions, the coupling medium is renewed and the sensor is mounted exactly at the same calculated position.
The displayed flow changes only slightly afterwards. The important point, however, is that SNR increases significantly and the required receive gain decreases.
The first measured value was therefore not obviously wrong. The measuring point simply had less signal margin.
This example demonstrates the value of diagnostic data: they help optimise an installation before poor process conditions or ageing of the coupling point actually cause unstable measurements or signal loss.
Systematic installation verification after commissioning
After installation, it should first be verified that the configured application data match the actual pipeline. This includes in particular pipe material, outside diameter or pipe geometry, wall thickness, medium and sensor type.
The mechanical sensor position is then checked. The specified spacing must be maintained reproducibly and both sensors must make clean and even contact with the pipe.
Only then does it make sense to evaluate the diagnostics.
A practical procedure is to first display SNR and RXGain for both directions. If these values are stable and plausible, Travel Time Up and Down and the resulting Delta Time are evaluated. The calculated sound velocity is then compared with the expected process condition.
If the diagnostics are unusual, several parameters should not be changed simultaneously. It is better to correct one possible cause at a time and then check again.
If the sensor spacing is changed, the coupling medium renewed and a different pipe wall thickness entered at the same time, it will be almost impossible afterwards to determine which change was actually responsible for the improvement.
Especially for demanding measuring points, it is therefore worthwhile to briefly document the diagnostic values during final commissioning.
Systematically interpreting typical diagnostic patterns
| Observation | Possible cause | Sensible check |
|---|---|---|
| Low SNR and high RXGain | Weak received signal | Check coupling point, sensor position and pipe condition |
| Upstream good, downstream significantly worse | Asymmetrical acoustic path or local installation deviation | Check both sensors and mountings separately |
| Signal values good, flow implausible | Incorrect pipe data, cross-section or configuration | Verify geometry and process data |
| Sound velocity implausible | Medium data, process condition or acoustic path do not match | Check medium, temperature, pipe data and sensor arrangement for plausibility |
| Delta Time fluctuates during a constant process | Unstable signal detection | Check SNR, RXGain, coupling point and process conditions |
| Diagnostic values gradually deteriorate over time | Coupling point or pipe condition has changed | Inspect measuring point and compare with commissioning values |
These classifications are deliberately intended as diagnostic guidance rather than automatic error codes. Several causes can produce the same symptom.
The advantage lies precisely in narrowing troubleshooting down from the general statement “ultrasonic measurement is not working” to specific parts of the measuring chain.
Multi-path measurement with the FS230
Depending on the configuration, the SITRANS FS230 can use several acoustic measurement paths. This makes the diagnostics even more informative.
With multi-path measurement, the diagnostic values of the individual paths can be compared with each other.
If, for example, three paths show very similar signal quality while a fourth path requires significantly higher receive gain, a local problem with that path is more likely than a general problem with the medium.
This is particularly helpful on large pipelines or demanding applications. A local pipe-wall condition, an individual coupling point or the position of one sensor can be identified more quickly.
Different flow velocities between several paths can also provide information about an unfavourable flow profile.
However, multi-path measurement does not replace correct installation. If all paths have been configured with incorrect pipe data, all diagnostic values may appear consistent while the calculated process value is still systematically wrong.
More paths therefore increase diagnostic information – not the need for careful configuration.
Suitable SITRANS components at ICS Schneider
ICS Schneider Messtechnik offers various Siemens SITRANS systems for clamp-on ultrasonic flow measurement. The appropriate version depends in particular on the medium, pipeline, accuracy requirements, number of measurement paths, Ex requirements and required communication.
The SITRANS FS220 is an economical clamp-on solution for liquid applications. The system combines the FST020 transmitter with FSS200 sensors. It is particularly suitable for conventional flow measurement in water, wastewater, HVAC and comparable applications.
In addition to the flow value, the FST020 provides various diagnostic parameters. These include signal-to-noise ratio, receive gain, sound velocity, Delta Time, transit-time values and correlation values. This makes it possible to assess sensor installation after commissioning much more accurately than by using the flow value alone.
For higher requirements, the SITRANS FS230 is available. The system is based on the more powerful FST030 and FSS200 clamp-on sensors. Depending on the version, several measurement paths can be used; extensive diagnostic, data logging and communication functions are also available.
The SITRANS FST030 provides a complete service and diagnostic menu as well as an internal data logger. This means that not only current process values but also diagnostic and operating information can be used for commissioning and troubleshooting.
For selecting a clamp-on measuring point, the following information should be known wherever possible: pipe material, outside diameter, wall thickness, any coating or lining, medium, temperature, pressure, expected flow velocity and required accuracy.
SITRANS ultrasonic flow measurement technology at ICS Schneider
Siemens process instrumentation at ICS Schneider
Further reading: Clamp-on flow measurement – operating principle and systems
Conclusion
With clamp-on ultrasonic measurement, the displayed flow value is only one part of the available information.
The SITRANS diagnostic values provide a direct view of the quality of the acoustic measurement path. SNR shows how clearly the useful signal can be distinguished from background noise. RXGain describes how strongly the receive electronics must amplify the signal. Transit times and Delta Time show how stably the actual transit-time measurement is functioning, while sound velocity provides an additional plausibility check for the medium and application.
A good installation should therefore not be reduced to the fact that the instrument produces a measured value at all.
A system with little signal margin may initially operate reliably under favourable process conditions. If the medium later changes, gas bubbles occur or the coupling point deteriorates, this lack of reserve can result in unstable measurements.
The diagnostic values make it possible to identify such a situation already during commissioning.
The opposite consideration is equally important: good signal diagnostics do not guarantee a correct volumetric flow value. Incorrect pipe diameter, incorrect wall thickness or unsuitable process parameters can cause systematic measurement deviations despite excellent signal transmission.
For a reliable SITRANS clamp-on measuring point, three levels must therefore match: mechanical installation, acoustic diagnostics and correct configuration.
By checking these three levels separately and documenting the diagnostic values of the final installation, not only is commissioning more reliable, but later changes to the measuring point can also be identified and corrected much more quickly.
FAQ on SITRANS ultrasonic diagnostic values
Which diagnostic values are particularly important with SITRANS clamp-on?
For installation verification, SNR, RXGain, Travel Time Up and Down, Delta Time and sound velocity are particularly useful. Depending on the transmitter, Peak Amplitude, signal correlation and additional diagnostic parameters are also available.
What does SNR mean in ultrasonic measurement?
SNR is the signal-to-noise ratio. A higher value generally means that the received ultrasonic signal is more clearly distinguishable from the background noise.
What does RXGain mean?
RXGain describes the required amplification of the received signal. A lower required gain generally indicates a stronger received ultrasonic signal.
Is a high RXGain automatically a fault?
No. The required gain depends on factors such as pipe size, wall thickness, material, sensor and medium. A high value becomes particularly interesting if it has deteriorated significantly compared with a similar installation or an earlier condition.
Why are RXGain and SNR available separately for Up and Down?
The ultrasonic signals are transmitted through the measurement path in both directions. The received-signal quality can therefore be assessed separately for upstream and downstream.
What does Travel Time Up or Down mean?
These values describe the measured transit time of the respective ultrasonic signal from transmission to reception. The small difference between the two directions is used for flow measurement.
What is Delta Time?
Delta Time is the measured transit-time difference between the ultrasonic signals travelling with and against the flow. It is a central parameter for calculating flow velocity.
Should Delta Time be zero at zero flow?
At actual zero flow, the two transit times should be almost identical and Delta Time should therefore approach zero. Real measuring systems, however, always have a certain measurement scatter and zero-point characteristic.
Can I detect incorrect sensor spacing from the diagnostics?
Unfavourable spacing can result in poorer signal quality, higher receive gain or less stable transit times. The diagnostics should be considered together with the calculated or specified sensor position.
Can a poor painted surface reduce SNR?
Yes. An unsuitable or uneven contact surface can impair acoustic coupling between the sensor and pipe wall. The pipe, specific coating and intended installation method are decisive.
What does sound velocity indicate about the installation?
An implausible sound velocity can indicate that process data, pipe parameters or acoustic path do not match the actual application. However, the value must be assessed while taking the medium, temperature and process condition into account.
Can the flow value appear correct even if the signal quality is poor?
Yes. Under favourable conditions, a measuring point may initially provide a plausible value despite having little signal margin. Diagnostic values can reveal this situation.
Can the signal quality be excellent while the flow value is still wrong?
Yes. An incorrect pipe diameter, incorrect wall thickness or other configuration errors can cause a systematic flow error even though the acoustic signal path works very well.
Why should diagnostic values be documented during commissioning?
They establish a reference condition for the measuring point. If SNR later deteriorates or RXGain increases significantly, the current condition can be compared with the original installation.
Can air in the medium affect signal quality?
Yes. Gas bubbles can strongly scatter or attenuate ultrasound. This can affect the signal-to-noise ratio, receive stability and ultimately measurement quality.
What is the benefit of signal correlation?
It provides additional information about how clearly and reproducibly the received ultrasonic signal is detected. It should be evaluated together with SNR, gain and transit time.
What is the advantage of the SITRANS FS230 compared with the FS220?
The FS230 is designed for more demanding applications and, depending on the configuration, supports multiple measurement paths as well as more extensive diagnostic, communication and data logging functions. The FS220 is an economical single-path solution particularly suited to conventional liquid applications.
Which SITRANS system is suitable for a simple water line?
For conventional water, wastewater or HVAC applications, the SITRANS FS220 can be a suitable solution. For higher accuracy requirements, multiple measurement paths, gases, hydrocarbons or more demanding diagnostic requirements, the FS230 is often the more suitable platform.
What information is required for selecting a SITRANS clamp-on system?
Particularly important are pipe material, outside diameter, wall thickness, any coating or lining, medium, temperature, process pressure, expected flow or flow velocity, installation conditions and required accuracy.