


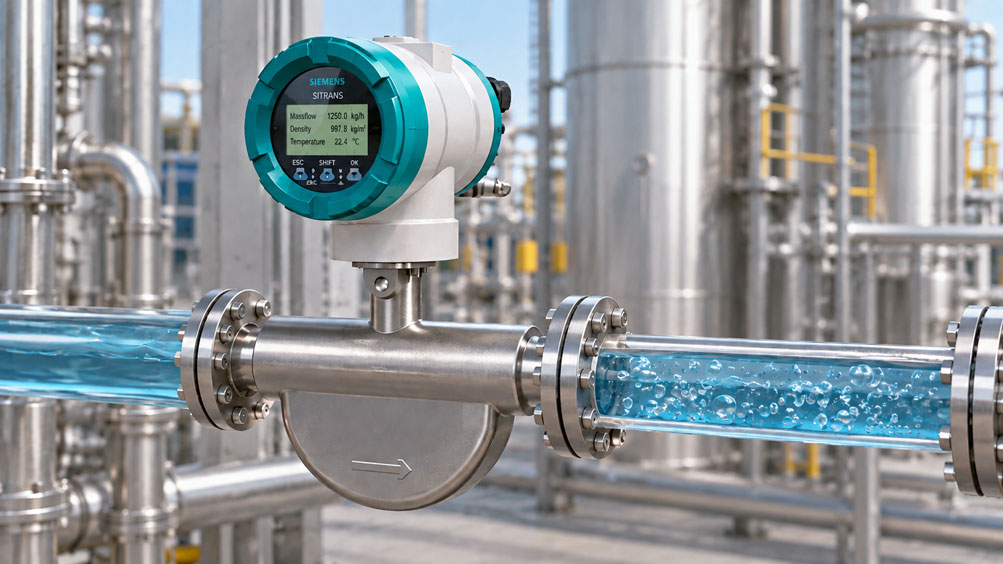
A Coriolis flow meter continuously monitors a liquid production stream. The mass flow initially appears plausible, but at the same time the measured density suddenly drops from:
998 kg/m³
to:
965 kg/m³
and then jumps back again within a few seconds.
Has the product composition changed? Was a different medium accidentally introduced? Or are there simply gas bubbles in the liquid?
This is precisely where an important additional benefit of modern Coriolis measuring instruments lies. They do not measure mass flow alone. The density of the medium can also be determined from the vibration behaviour of the measuring tubes. In addition, temperature measurement is normally available.
The density value can therefore be used as an additional process indicator, for example to detect:
- product changes,
- changes in concentration,
- mixing errors,
- dilution,
- gas bubbles,
- incompletely filled measuring tubes.
However, the key limitation is:
A change in the Coriolis density value does not have only one possible cause. Density, temperature, mass flow, process pressure, the time profile and device diagnostics must be considered together before a density deviation is interpreted as an actual product change.
How does a Coriolis flow meter work?
A Coriolis flow meter contains one or more vibrating measuring tubes.
These are excited into controlled vibration by a driver.
When mass flows through the vibrating tube, Coriolis forces are generated.
They cause a very small temporal or spatial displacement in the tube movement.
From this phase shift, the measuring system determines the:
mass flow
.
At the same time, the vibration behaviour contains further information.
Depending on the measuring system, this can also be used to determine, among other things:
- density,
- temperature,
- volumetric flow,
- derived concentration or process variables.
A Coriolis instrument therefore provides several pieces of information about the same process condition.
This combination in particular makes the measuring principle interesting for process diagnostics.
How does a Coriolis instrument determine density?
The natural frequency of the vibrating measuring tube depends, among other things, on its moving mass.
This consists of:
mass of the measuring tube + mass of the contained medium
.
If the density of the medium changes, the dynamic behaviour of the measuring tube also changes.
In simplified terms:
higher fluid density → greater moving mass → lower resonance frequency
and correspondingly:
lower fluid density → lower moving mass → higher resonance frequency
.
The measuring instrument evaluates this change and calculates the fluid density from it.
The density value therefore originates from the same physical measuring system as the mass flow, but is determined from a different property of the tube vibration.
Why is density suitable as a quality indicator?
Many liquids have a characteristic density at a defined temperature.
If their composition changes, the density can therefore change as well.
Examples include:
- a change in concentration,
- dilution with water,
- mixing of two products,
- product change,
- incorrect formulation,
- contamination.
A continuously measured density value can therefore indicate a process deviation much earlier than a laboratory sample taken later.
Example:
Under normal process conditions, a product typically has:
ρ = 1,035 kg/m³
If the process reproducibly changes to:
ρ = 1,020 kg/m³
this may indicate a change in composition.
The density value therefore becomes a:
continuous process indicator
.
However, it is not automatically an unambiguous chemical analysis.
Why is a reference condition required?
A single density value is only meaningful if the expected value for the normal process is known.
A reference condition should therefore be defined.
This can include, for example:
- product,
- temperature,
- process pressure,
- normal flow range,
- permissible density range.
Temperature is particularly important.
Many liquids change their density significantly with temperature.
The statement:
target density = 1,000 kg/m³
is therefore considerably less meaningful than:
target density at a defined temperature or a temperature-dependent target curve
.
For reliable quality monitoring, the normal relationship between:
density ↔ temperature ↔ process condition
should therefore be known wherever possible.
What does a genuine process change look like?
An actual change in product composition often exhibits different time behaviour from short-term gas ingress.
Typical characteristics of a genuine product change may include:
- density shifts to a new stable value,
- the change remains over a longer period,
- temperature behaviour is consistent with the new product composition,
- mass flow remains comparatively stable,
- no unusual device diagnostics occur.
Example:
1,020 → 1,018 → 1,015 → 1,012 kg/m³
and then:
stable at approximately 1,012 kg/m³
.
Such a transition may, for example, be consistent with a product change or increasing dilution.
However, the time behaviour must always be consistent with the actual process sequence.
How do gas bubbles change the density value?
Gas normally has a considerably lower density than the surrounding liquid.
If gas bubbles enter a Coriolis measuring tube operating with liquid, the medium inside the tube is temporarily no longer homogeneous and single-phase.
In simplified terms, a mixture of:
liquid + gas
is created.
The effective density of this mixture is lower than the density of the pure liquid.
The measuring instrument may therefore indicate a lower density value.
At the same time, two-phase flow affects the mechanical vibration behaviour of the measuring tubes.
Possible symptoms include:
- brief density drops,
- strongly fluctuating density,
- unstable mass flow,
- abrupt changes in volumetric flow,
- diagnostic messages or reduced measurement quality.
A typical pattern may, for example, look like:
998 → 972 → 990 → 960 → 996 kg/m³
within a short period.
Such an unstable profile is more indicative of an unstable process condition than of a uniform change in product concentration.
Why is density alone insufficient for diagnosis?
A low density does not prove the presence of gas bubbles.
Likewise, a low density does not prove a product change.
Several causes can produce the same density value.
For example:
- actual dilution,
- a lighter product,
- an increase in temperature,
- entrained air
can all result in a lower reading.
The situation becomes particularly difficult if the gas ingress is relatively constant.
A continuously entrained small quantity of gas can under certain circumstances produce a comparatively stable but excessively low density value.
A quality decision should therefore never be based solely on a single density value if multiphase conditions are possible in the process.
How does temperature help distinguish the causes?
Temperature is one of the most important comparison variables.
Many genuine density changes can at least partly be explained by temperature.
Example:
If the product temperature rises continuously and the density simultaneously decreases according to the known product characteristic, this initially suggests normal temperature-related behaviour.
The situation is different if:
temperature remains stable
while:
density suddenly changes significantly
.
A purely thermal cause is then less likely.
For quality monitoring, density and temperature should therefore always be considered together.
A temperature-compensated target curve is particularly useful:
ρtarget = f(T)
The current measurement can then be compared with this expected value.
What does mass flow reveal?
Mass flow provides a second important indication.
If the product density changes due to a genuine, stable change in composition, the mass flow can continue to be measured relatively steadily.
With gas bubbles or pronounced two-phase flow, however, the flow measurement often also becomes more unstable.
A possible diagnostic pattern is therefore:
| Observation | Possible interpretation |
|---|---|
| Density changes slowly, mass flow stable | Product or temperature change more likely |
| Density fluctuates, mass flow also unstable | Gas bubbles or unstable two-phase flow more likely |
| Density consistently incorrect, flow stable | Check product, temperature, calibration or stable foreign component |
| Density and flow both collapse during emptying | Check for partially filled measuring tubes or running empty |
This classification is a diagnostic aid, not mathematical proof.
Why should process pressure also be considered?
Gas bubbles often do not occur randomly.
They can be directly related to process pressure.
Possible causes include:
- pressure too low on the pump suction side,
- pressure drop across a valve,
- release of dissolved gases,
- cavitation,
- partially empty pipework.
A particularly informative pattern is therefore:
pressure drops → density becomes unstable → mass flow becomes unstable
.
Such a correlation is more indicative of a hydraulic or pneumatic process disturbance than of a sudden change in formulation.
For critical applications, it can therefore be useful to measure pressure at the relevant process point and trend it together with the Coriolis signal.
Why can the calculated volumetric flow be particularly noticeable?
A Coriolis flow meter measures mass flow directly.
Volumetric flow can be derived from mass and density.
In simplified form:
Qv = Qm / ρ
Where:
Qv= volumetric flow,Qm= mass flow,ρ= density.
If the density suddenly decreases because of gas bubbles, the calculated volumetric flow changes as well.
This can result in particularly large jumps in the volumetric flow value.
During diagnosis, it should therefore be clarified which displayed variables are:
- measured directly and
- calculated from other measured variables
.
Why is the rate of change important?
Not only the magnitude of a density deviation is relevant.
Its time dynamics also provide information.
A genuine concentration change in a large vessel may, for example, take:
several minutes
.
A single plug of gas bubbles, on the other hand, can change the density value within:
seconds
.
In addition to absolute density, its rate of change can therefore also be monitored.
In simplified form:
dρ / dt
A very rapid density change can be used as an additional diagnostic indication.
However, the permissible limit must be derived from actual process behaviour.
Which measured variables should be recorded together?
For reliable diagnosis, several process variables should ideally be recorded synchronously over time.
Particularly useful are:
- density,
- mass flow,
- temperature,
- volumetric flow,
- process pressure, if available,
- valve or pump status,
- device status and diagnostic messages.
This makes it much easier to assign events later.
Example:
10:15:02 valve opens
10:15:04 process pressure drops
10:15:05 density drops sharply
10:15:05 mass flow becomes unstable
This combination provides significantly more information than the isolated message:
density outside tolerance
.
Which device diagnostics provide additional help?
Modern Coriolis systems monitor not only the actual process values but also the condition of the vibrating measuring system.
Depending on the device version, additional diagnostic and verification information is available.
This can provide indications of:
- unstable measuring conditions,
- measuring tube condition,
- device faults,
- unusual process behaviour
.
A diagnostic message should therefore not be suppressed simply because the currently displayed mass flow still appears plausible.
For quality monitoring in particular, it is useful to determine whether the density deviation occurs:
while the measurement is technically stable
or:
at the same time as abnormal measuring-system behaviour
.
What happens during start-up and refilling?
After maintenance, emptying or a product change, air or gas is often initially present in the pipework.
During refilling, the Coriolis sensor therefore temporarily passes through different conditions:
empty → gas → gas/liquid → completely filled with liquid
During this transition phase:
- density,
- mass flow,
- volumetric flow
cannot be compared with a normal steady-state production condition.
Quality release should therefore only take place after:
- the measuring section is completely filled,
- entrapped air has been displaced,
- density and flow are stable
.
How does a product change differ from trapped air?
With a planned product change, a relatively clear transition often occurs.
Example:
Product A:
ρ ≈ 1,050 kg/m³
Product B:
ρ ≈ 980 kg/m³
During the transition, a mixed phase may initially occur.
Afterwards, however, the value should stabilize at the level expected for product B.
With gas bubbles, the profile is often less reproducible:
1,050 → 1,010 → 1,045 → 995 → 1,047 kg/m³
.
In addition, mass flow and other diagnostic variables may become unstable at the same time.
Stability after the event is therefore often just as important as the density deviation itself.
What role do the pump and suction side play?
Gas bubbles can already form upstream of the Coriolis sensor.
A common cause is the suction side of a pump.
Possible faults include:
- leaking fitting,
- leaking mechanical seal,
- insufficient inlet head,
- blocked filter,
- excessive pump flow rate,
- insufficient vessel level.
This can allow air to be drawn in or reduce the local pressure so much that dissolved gases are released from the medium.
The Coriolis measuring instrument then merely displays the consequences of a process disturbance even though the sensor itself is operating correctly.
How can pressure drops generate gas bubbles?
Gas bubbles can also form inside a completely closed pipe.
A fluid can contain dissolved gases.
If the pressure decreases sufficiently, these gases can come out of solution.
Typical locations with significant pressure drops include:
- control valves,
- restrictions,
- pump inlets,
- constrictions,
- high sections of pipework.
If the density deviation occurs only at a particular valve position or pump speed, this relationship should be investigated.
Which installation conditions are important?
Coriolis flow meters are often less sensitive to the conventional flow profile than many other flow-measuring principles.
However, the installation conditions are still not arbitrary.
For liquid applications, it should be ensured in particular that:
- the measuring tubes remain completely filled,
- gas does not permanently collect in the sensor,
- the installation orientation is suitable for the application,
- pipe stresses are avoided wherever possible,
- strong external vibrations are not unnecessarily transmitted into the sensor.
The optimum installation orientation depends on sensor design, medium and application and should be selected according to the relevant manufacturer’s instructions.
A correctly configured measuring instrument cannot fully compensate for permanently unfavourable two-phase flow.
How can useful density monitoring be configured?
Simple monitoring uses a lower and upper density limit.
Example:
995 ... 1,005 kg/m³ = normal
and:
outside this range = warning
.
However, such a fixed limit only works if the normal density is sufficiently constant.
With significant temperature dependence, a dynamic limit is better.
For example:
ρmin(T) ≤ ρmeas ≤ ρmax(T)
A time condition can also be used.
A single brief density excursion then does not necessarily have to trigger a product alarm immediately.
Example:
density outside target range for longer than 10 s → quality warning
Whereas:
very rapid density drop + unstable flow → process/gas-bubble alarm
can be handled separately.
Why must strong damping not hide gas bubbles?
Measurement damping can make a display appear visually steadier.
However, it does not eliminate the cause of unstable measurement.
Very strong damping can even smooth short density fluctuations so much that the actual process disturbance is barely visible.
A certain degree of damping may be useful for process control.
For diagnostics and quality monitoring, however, sufficiently fast raw or trend information should remain available wherever possible.
A stable displayed value is not automatically proof of a stable process.
When is an external product analysis required?
Density measurement is a powerful inline indicator.
However, it cannot uniquely identify every chemical change.
Two different products can under certain conditions have:
the same density
.
Conversely, the same product composition can have different densities at different temperatures.
For a quality-critical decision, an additional:
- laboratory analysis,
- conductivity measurement,
- refractive-index measurement,
- pH measurement,
- specific concentration measurement
may therefore be required.
The Coriolis density value is particularly useful as a continuous indicator that makes abnormal process conditions visible at an early stage.
Practical example: density drops during filling
A liquid is conveyed through a Coriolis flow meter to a filling system.
Normal process condition:
Density: 1,025 kg/m³
Temperature: 22 °C
Mass flow: stable
During a production phase, the density suddenly drops to:
985 kg/m³
.
After a few seconds, it returns to:
1,023 kg/m³
.
At the same time, the mass flow shows brief fluctuations.
The temperature remains practically unchanged.
Trend analysis also shows that the event always occurs immediately after the pump speed is increased.
The formulation itself has not been changed.
Inspection reveals that the pressure on the pump suction side drops significantly at high delivery rates.
The medium begins to release dissolved gas locally.
The resulting gas bubbles pass through the Coriolis sensor.
After adjusting the pump operating point, the pressure remains higher and the density remains stable.
The low density value was therefore not proof of an incorrect product composition, but a process indicator of temporary two-phase flow.
Systematically diagnosing density deviations
- Determine the normal density range of the product.
- Check the current product temperature.
- Compare the density with the expected temperature-dependent density.
- Examine the time profile of the density value.
- Check mass flow at the same time.
- Check volumetric flow for unusual jumps.
- Consider process pressure and pump condition.
- Correlate valve positions and process events over time.
- Evaluate device diagnostics.
- Check whether the measuring tube is completely filled with liquid.
- Check the pump and suction side for air ingress.
- Investigate pressure drops and possible gas release.
- For planned product changes, take the transition phase into account.
- For a permanent density change, independently verify the product or concentration.
- Only then evaluate device calibration or sensor faults as possible causes.
Planning a Coriolis measuring point for quality monitoring
- Clearly define the medium to be monitored.
- Determine the normal density range.
- Take the temperature dependence of density into account.
- Define minimum and maximum mass flow.
- Select the appropriate sensor size.
- Assess the permissible pressure drop.
- Consider process pressure and possible gas release.
- Plan the measuring point so that the tubes remain completely filled.
- Avoid gas accumulation in the sensor.
- Include the pump and control valves in the process assessment.
- Make density, temperature and mass flow available in the control system.
- Provide trend recording for the relevant measured variables.
- Define target ranges or temperature-dependent limits.
- Do not automatically equate a gas-bubble alarm with a quality alarm.
- Integrate diagnostic messages from the measuring instrument into the PLC or control system.
Common mistakes
- Interpreting every density deviation as a quality fault: Gas bubbles and multiphase flow can also cause significant density changes.
- Considering density without temperature: A normal thermally induced density change can mistakenly be interpreted as a product change.
- Evaluating only an instantaneous value: The time profile and rate of change provide important diagnostic information.
- Ignoring mass flow: Simultaneously unstable flow can be an important indication of gas bubbles.
- Not considering process pressure: Gas release or cavitation can be caused by a local pressure drop.
- Interpreting jumps in volumetric flow directly as a genuine increase in flow: The calculated volumetric flow is influenced by changes in density.
- Evaluating the start-up phase as a normal production condition: During refilling, air and liquid may temporarily flow through the sensor together.
- Setting the density alarm too tightly: Normal temperature and process fluctuations can generate unnecessary alarms.
- Delaying the density alarm too strongly: Brief gas-bubble events can be completely hidden.
- Using strong damping as a fault correction: The display becomes calmer, but the process disturbance remains.
- Treating Coriolis measurement as a chemical analyser: A density change cannot always be uniquely assigned to a particular change in composition.
- Recalibrating the sensor before checking the process: Gas bubbles, incomplete filling or process instability must not be incorporated into a device correction.
SITRANS FC540 and FCT040 for multiparameter measurement
Siemens SITRANS FC540
For applications in which additional process information such as density and temperature is required alongside flow, the Siemens SITRANS FC540, for example, is suitable.
The multiparameter Coriolis system combines:
SITRANS FCS500 sensor + SITRANS FCT040 transmitter
.
Depending on the configuration, the following measured and evaluated variables are available, among others:
- mass flow,
- density,
- temperature,
- volumetric flow,
- concentration or fraction,
- additional diagnostic and supplementary functions.
The FCS500 is available for universal process applications as well as corresponding hygienic applications.
This makes the system suitable, among other things, for:
- product monitoring,
- dosing,
- mixing processes,
- food and beverage processes,
- chemical processes,
- quality and trend monitoring.
Further information can be found for the SITRANS FC520/540 Coriolis multiparameter flow measurement system.
Siemens SITRANS FCT040
The SITRANS FCT040 is the advanced transmitter in the current SITRANS FC Coriolis family.
It can be combined with various SITRANS FC sensors and is particularly suitable for applications in which additional process information is required alongside conventional flow measurement.
Depending on the version or ordered function, the following can be used, among others:
- density,
- temperature,
- concentration or fraction,
- viscosity,
- batch functions,
- tube-condition and verification functions
.
For the application described here, it is particularly important that density does not have to be considered in isolation but can be evaluated together with additional process and diagnostic information.
Further Coriolis systems can be found under Coriolis flow measurement at ICS Schneider.
The complete product overview can be found under flow measurement technology at ICS Schneider.
Conclusion
The density measurement of a Coriolis flow meter can provide far more than just an additional numerical value.
For a known product, it can be used as a sensitive continuous indicator of process and quality changes.
However, a density deviation must not automatically be interpreted as a change in product composition.
Gas bubbles and two-phase flow can also cause significantly lower or strongly fluctuating density values.
The most reliable distinction is therefore achieved by combining several pieces of information.
A genuine product change often results in a new, reproducible density level that is plausible in relation to temperature and the process sequence.
Gas bubbles, on the other hand, often cause rapid or unstable density changes and occur simultaneously with mass-flow fluctuations, pressure changes or other diagnostic indications.
However, even this distinction is not a universal mathematical rule. A stable gas fraction can, for example, cause a permanently shifted density value.
For quality-critical processes, density, temperature, mass flow, pressure and device diagnostics should therefore be trended together.
The Coriolis density value becomes particularly valuable when it is not considered in isolation as a product value, but as part of multiparameter process diagnostics: detect the density change, check the temperature relationship, assess the time dynamics, compare mass flow and process pressure, and only then decide whether there is an actual product change or a disturbance caused by gas bubbles.
FAQ: Coriolis density as a quality indicator
Can a Coriolis flow meter measure density?
Yes. In addition to mass flow, the density of the contained medium can be determined from the vibration behaviour or resonance frequency of the measuring tubes.
Can the density value be used for quality control?
Yes. With a known product, a change in density can indicate changes in concentration, mixing or product composition. However, the value should be assessed together with temperature and other process variables.
Why do gas bubbles change the measured density value?
Gas has a significantly lower density than liquid. If gas and liquid are present in the measuring tube at the same time, the measured mixture density changes, as does the vibration behaviour of the Coriolis sensor.
Does a low density automatically mean gas bubbles?
No. A different product, dilution or a temperature change can also reduce the density. The density value alone therefore does not allow an unambiguous determination of the cause.
How can I detect gas bubbles in a Coriolis signal?
Typical indications include rapid or unstable density fluctuations, simultaneously unstable mass flow and a correlation with changes in pumps, valves or pressure. Additional device diagnostics should also be evaluated.
What does a genuine product change typically look like?
The density value often shifts to a new stable level and remains there. The change should be plausible in relation to temperature, formulation and the actual process sequence.
Why must temperature be considered together with density?
The density of many liquids depends on temperature. A normal temperature change can therefore cause a density difference even though the product composition has not changed at all.
Why is process pressure important for diagnosis?
When pressure falls, dissolved gases can come out of solution or cavitation can occur. If a density disturbance occurs at the same time as a pressure drop, this is an important indication of a process disturbance.
Can a product containing gas bubbles still show a stable density value?
Yes. A relatively constant gas fraction can under certain circumstances produce a permanently shifted density value. Therefore, even a stable value alone is not reliable proof of a single-phase medium.
Why can volumetric flow jump significantly when gas bubbles are present?
Volumetric flow can be calculated from mass flow and density. If density changes rapidly, this therefore also affects the calculated volumetric flow.
Can strong measurement damping solve the problem?
No. Damping can make the display appear more stable, but it does not eliminate gas bubbles or two-phase flow. Excessive damping can even hide important diagnostic information.
Which values should I trend together?
Density, mass flow, temperature, volumetric flow, process pressure where available, as well as device and process status messages are particularly useful.
Which Siemens Coriolis flow meter is suitable for density and process monitoring?
One specific example is the SITRANS FC540 with FCS500 sensor and FCT040 transmitter. In addition to mass flow, the system provides density, temperature and further multiparameter and diagnostic functions.
Can Coriolis density completely replace laboratory analysis?
Not in every application. Density is a very powerful continuous process indicator, but different material compositions can under certain conditions have the same density. For quality-critical decisions, an additional analytical measurement may therefore be required.