


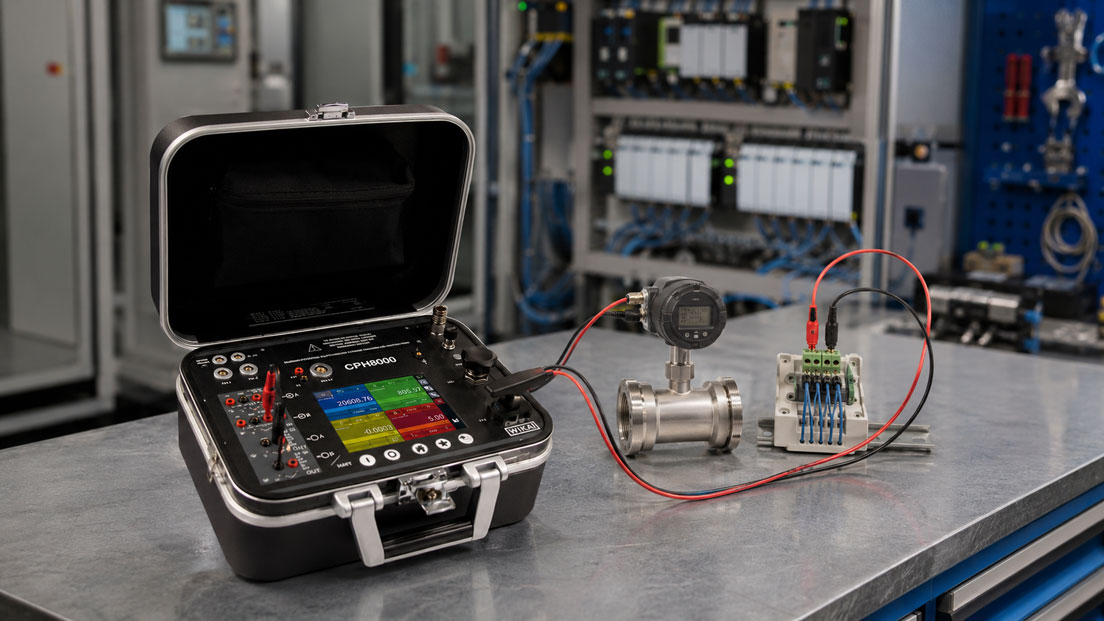
Many flow meters, turbine flow meters, paddle wheel meters, gear meters, dosing systems and test benches do not only work with analog signals, but also with frequency or pulse outputs. The frequency often corresponds to the current flow rate, while the number of pulses represents a quantity or volume. For displays, counters, PLCs and control systems, it is therefore crucial that frequency signal, pulse count, K-factor and scaling match correctly.
If a flow display shows incorrect values, a counter counts too much or too little, or the PLC frequency input does not respond plausibly, the cause is not automatically the flow meter itself. Errors are often caused by incorrect parameterization, unsuitable signal levels, faulty pulse evaluation, an incorrect K-factor, too high a limit frequency, interference on the cable or unsuitable input circuitry.
With a suitable calibrator or simulator, frequency and pulse signals can be generated in a targeted manner. This makes it possible to check whether the display, counter, PLC input, data logger or controller evaluates the simulated flow correctly. This article explains how frequency and pulse signals work in flow meters, how K-factors can be checked and what must be considered regarding signal level, counter function, limit frequency, scaling and documentation.
Table of contents
- Basics: what are frequency and pulse signals?
- Why flow meters often output pulses or frequencies
- Understanding K-factor, pulses per liter and scaling
- Simulating a frequency signal: reproducing flow values in a targeted way
- Simulating a pulse signal: testing counters, totalizers and quantity measurement
- Testing PLC frequency inputs and high-speed counters
- Consider signal level, input circuitry and wiring
- Limit frequency, minimum pulse width and fast counting pulses
- Typical error patterns with frequency and pulse signals
- Testing, calibration and documentation of the measurement chain
- Practical example: turbine flow meter shows incorrect flow on the counter
- Which measuring instruments / products are suitable?
- Conclusion: always test frequency and pulse as a complete measurement chain
- FAQ: frequently asked questions about simulating frequency and pulse signals
Basics: what are frequency and pulse signals?
A frequency signal consists of recurring electrical state changes per unit of time. Frequency is specified in hertz and describes how many pulses or periods occur per second. In flow measurement technology, a higher frequency often means a higher current flow rate. When more medium flows through the sensor, the sensor generates more pulses per second.
A pulse signal is often used for quantity measurement. Each pulse represents a defined partial quantity, for example a certain volume portion. A counter sums the pulses and calculates the total quantity, dosing quantity or consumption from them. In many applications, frequency and pulse are technically generated by the same signal, but evaluated differently: as current flow rate or as accumulated quantity.
The relationship between sensor signal and process value is defined by the scaling. For turbine flow meters and many volume sensors, the K-factor is decisive for this. It describes how many pulses are generated per defined quantity. From pulse count and time, the evaluation unit can calculate the current flow rate. From the total pulse count, it can determine the total quantity.
For troubleshooting, it is important to understand that a frequency or pulse signal is not automatically a “finished” flow value. It must be correctly interpreted by the display, controller, PLC or counter. If signal form, signal level, K-factor or input setting do not match, a technically correctly operating sensor can still generate incorrect values in the control system.
| Signal type | Meaning | Typical application |
|---|---|---|
| Frequency signal | Pulses per second, proportional to a process variable | Current flow rate, speed, velocity |
| Pulse signal | Individual pulses are counted | Volume, quantity, consumption, batch counting |
| K-factor | Pulses per defined unit | Conversion of pulse count into liters, m³ or another quantity unit |
| Counter function | Sums pulses over a time period or batch | Dosing, filling, consumption measurement |
| Frequency input | Detects fast pulses or periods | PLC, display, data logger or test bench |
Why flow meters often output pulses or frequencies
Many flow measurement principles naturally generate a pulsed signal. In a turbine flow meter, a rotor turns in the flow channel. Within the permissible measuring range, the rotor speed is linked to the volumetric flow rate. A sensor detects the movement and outputs pulses or a frequency from it. The higher the flow rate, the higher the pulse frequency.
Gear meters, oval gear meters, paddle wheel meters and certain dosing counters also work with recurring mechanical movements that can be detected electrically. The advantage is that the evaluation can calculate both the current flow rate and the total quantity. A frequency input provides the current value, while a counter sums the pulses to determine the quantity.
Pulse and frequency outputs are particularly common in test benches, dosing systems, filling processes, mobile hydraulic applications, water technology, oil supply, fuel measurement and process automation. They can be easily combined with digital counters, PLC high-speed counters or special flow displays.
At the same time, measurement quality depends heavily on correct evaluation. A sensor can operate mechanically correctly and deliver the correct pulse sequence, but an incorrectly parameterized display will still show an incorrect flow rate. In practice, it is therefore very useful not only to test the sensor with real flow, but also to test the evaluation with a simulated signal.
Understanding K-factor, pulses per liter and scaling
The K-factor is a central parameter for flow meters with pulse or frequency output. It indicates how many pulses the sensor generates per defined quantity. The K-factor is often specified as pulses per liter, pulses per m³ or pulses per gallon. Depending on manufacturer and device, the unit may also be specified differently. The decisive point is that the evaluation uses the same unit as the sensor.
Example: A turbine flow meter generates 1,000 pulses per liter. If the counter registers 10,000 pulses, this corresponds to 10 liters. If these 10,000 pulses occur within one minute, a flow rate of 10 liters per minute can be calculated. However, if the K-factor is accidentally entered as 100 pulses per liter, the evaluation shows a quantity that is wrong by a factor of ten.
For many sensors, the K-factor is not just a theoretical value, but is determined as part of a calibration. It can depend on the medium, viscosity, measuring range, installation situation and size. Especially with turbine flow meters, it is important to use the correct K-factor for the specific application and the relevant flow range.
Simulating a frequency or pulse signal helps check the scaling independently of the real medium. If a simulator outputs a defined frequency or pulse count, the display must show the corresponding flow rate or the correct quantity. If the value deviates, the cause is often the K-factor, unit, time base or input setting.
| Parameter | Meaning | Typical error |
|---|---|---|
| K-factor | Pulses per quantity unit | Incorrect value or incorrect unit entered. |
| Pulse count | Total counted pulses | Counter loses pulses or counts interference as pulses. |
| Frequency | Pulses per second | Incorrect conversion into flow due to wrong time base. |
| Unit | Liters, m³, ml, gallons or another quantity unit | Conversion between units not considered. |
| Measuring range | Minimum and maximum flow rate | Simulation lies outside the valid sensor or input range. |
Simulating a frequency signal: reproducing flow values in a targeted way
In frequency simulation, a defined electrical pulse train is generated that represents a specific flow rate. The frequency corresponds to the value that a real sensor would deliver at a certain volumetric flow rate. This makes it possible to check whether the display, PLC or counter calculates the simulated flow correctly.
The advantage is that no real flow needs to be generated. This is particularly helpful in large systems, test benches, sensors that are difficult to access or media that are only available under process conditions. The evaluation can be checked in the control cabinet or directly at the input module without opening the pipeline or conveying medium.
For meaningful simulation, the frequency must be calculated from the K-factor and the desired flow rate. If the K-factor is specified in pulses per liter and a flow rate in liters per minute is to be simulated, the time base must be taken into account correctly. Small calculation errors otherwise lead to incorrect test results.
In practice, several points are often simulated: a low flow close to the start of the measuring range, a medium operating value and a high flow close to the upper measuring range. This makes it possible to determine whether the scaling is plausible over the entire range and whether the evaluation works reliably at low or high frequencies.
Simulating a pulse signal: testing counters, totalizers and quantity measurement
While frequency simulation mainly tests the current flow rate, pulse simulation is used to check counter functions. The simulator outputs a defined number of pulses. The display, counter or PLC must calculate the correct total quantity from this. This is particularly important for dosing, filling, batch processes and consumption measurement.
A typical test consists of outputting a known pulse count and comparing the displayed total. With a K-factor of 1,000 pulses per liter, exactly 5,000 simulated pulses must result in a displayed value of 5 liters. If the display shows 50 liters, 0.5 liters or another quantity, the scaling is incorrect.
For counter functions, start, stop, reset and overflow behavior are also important. Some control systems count only during an enable signal. Others store the counter value retentively or reset it at batch start. If such functions are not parameterized correctly, quantity measurement can be wrong despite the input signal being correct.
Pulse simulation is also helpful for detecting lost pulses. If a simulator outputs a fixed number of pulses but the evaluation counts fewer pulses, input filters, minimum pulse width, limit frequency, signal level or wiring may be the cause. If more pulses are counted, interference, bouncing or faulty edge evaluation may be involved.
Testing PLC frequency inputs and high-speed counters
Standard digital PLC inputs are not always suitable for fast pulse sequences. Many flow meters deliver frequencies at high flow rates that can overwhelm a standard digital input. Frequency inputs or high-speed counters are used for such applications. These inputs are designed to reliably detect fast pulses.
When testing a PLC frequency input, it must be clarified which maximum frequency can be processed, which input voltage is expected, which edge is counted and which filters are active. An input can be electrically connected correctly, but a filter that is too strong may suppress fast pulses. Conversely, too little filtering can count interference.
The simulation of a frequency signal enables targeted testing of the input range. Low, medium and high frequencies can be applied to check whether the PLC records the value stably and correctly. The upper flow range is particularly important because this is where the highest frequency occurs and lost pulses can cause the greatest quantity error.
The software evaluation should also be considered. Some programs calculate flow from pulses per time window, others from period duration or moving averages. At low frequencies, the display may jump if the time window is too short. With fast control loops, however, a time window that is too long can make the display too sluggish.
| Test point at PLC input | Why relevant? | Possible consequence of error |
|---|---|---|
| Maximum input frequency | The input must reliably detect all pulses | Pulses are lost at high flow. |
| Minimum pulse width | Pulses that are too short may not be detected | Counter value or flow rate is too low. |
| Signal level | The input expects certain voltage or logic levels | Signal is not detected or is detected unreliably. |
| Filter time | Suppresses interference but can smooth fast pulses | Excessive filtering reduces the counted pulse number. |
| Edge evaluation | Rising, falling or both edges can be counted | Pulse count is halved or doubled. |
Consider signal level, input circuitry and wiring
Frequency and pulse signals can be electrically very different. Depending on sensor and evaluation, NPN, PNP, push-pull, open collector, NAMUR, TTL or voltage-based signals may occur. The decisive factor is that output and input are electrically compatible. A frequency value alone is not sufficient for selection or testing.
An open-collector output, for example, usually requires a pull-up resistor or corresponding input circuitry. A PNP output typically switches to positive, while an NPN output switches to negative. A PLC input must be wired accordingly. If this logic is not understood, a signal may not be detected despite the frequency being correct.
The sensor supply also plays a role. Many flow sensors require a separate supply voltage, while the output only provides the signal. During simulation, the real sensor is often disconnected and the simulator is connected directly to the input. It must be clear whether the input requires its own supply, a pull-up or a defined reference.
Interference is often caused by long cables, missing shielding, poor grounding, parallel motor cables, frequency converters or contactors. With fast pulses, contact problems and poor terminals can also become apparent. Clean wiring is therefore just as important as correct parameterization.
Limit frequency, minimum pulse width and fast counting pulses
Every evaluation unit has a maximum frequency that it can reliably detect. This limit frequency must not be exceeded during operation. With flow meters that have a high K-factor, even a moderate flow rate can result in a very high pulse frequency. If the input is too slow, pulses are lost and the displayed flow rate is too low.
In addition to frequency, pulse width is important. A signal may have a permissible frequency, but very short high or low times. If the input electronics cannot reliably detect these short states, pulses are not counted. Active filters in the PLC input can also suppress short pulses.
Testing should therefore not simulate only one operating value. It is useful to consider the entire relevant frequency range. In particular, maximum flow should be tested as the highest frequency. A simulation just above the expected operating range can also show whether sufficient reserve is available.
If pulses are lost, this has a direct effect on quantity measurements. A counter that records only 98 percent of the pulses also displays only 98 percent of the actual quantity. In dosing, billing, test bench evaluation or batch reports, this can cause significant errors.
Typical error patterns with frequency and pulse signals
Errors with frequency and pulse signals appear in different ways in practice. A display may show zero despite real flow, even though the sensor is delivering pulses. A counter may count up too quickly because interference is evaluated as additional pulses. A PLC may jump in the lower flow range because the calculation time is too short. Or the flow value may be correct at low quantities but increasingly too low at high flow rates.
A very typical error is an incorrect K-factor. In that case, the signal is electrically correct, but the conversion is wrong. Another common error is an incorrect unit, for example pulses per liter in the sensor but pulses per cubic meter in the evaluation. Decimal points, time base and scaling factors also often lead to deviations by factors of 10, 60 or 1,000.
Electrical errors often appear more irregular. If the display jumps sporadically, the counter continues counting without flow, or the value becomes unstable only when a motor is running, interference, shielding, grounding or input circuitry are suspect. If the error occurs only at high flow, limit frequency, minimum pulse width or filtering should be checked instead.
Simulation helps separate these errors. If the evaluation works correctly with a simulated signal, the cause is more likely to be the sensor, medium, installation or real process. If the evaluation already shows incorrect values with the simulated signal, the cause is more likely to be parameterization, wiring, input or software.
| Error pattern | Possible cause | Test approach |
|---|---|---|
| Display remains at zero | Wrong input, wrong signal level, no supply, wiring error | Connect simulator directly to the input and check signal level. |
| Counter counts too much | Interference, bouncing, both edges counted, incorrect filtering | Simulate defined pulse count and compare counter value. |
| Counter counts too little | Limit frequency exceeded, pulses too short, filter time too long | Increase frequency step by step and check for |
| Counter counts too much | Interference, bouncing, both edges counted, incorrect filtering | Simulate defined pulse count and compare counter value. |
| Counter counts too little | Limit frequency exceeded, pulses too short, filter time too long | Increase frequency step by step and check for counting loss. |
| Flow value wrong by factor 10 or 100 | Incorrect K-factor, wrong unit or decimal point | Check K-factor, unit and time base. |
| Value jumps at low frequency | Measurement window too short, low pulse count per time interval | Check calculation time, averaging or damping. |
Testing, calibration and documentation of the measurement chain
The simulation of frequency and pulse signals is a test of the electrical evaluation and parameterization. It does not automatically replace flow calibration of the sensor with real medium or a suitable test bench. A flow meter may be mechanically contaminated, damaged or outside its characteristic curve even if the PLC evaluates a simulated signal correctly.
Nevertheless, simulation is a very important part of troubleshooting and commissioning. It separates the electrical measurement chain from the process. If display, counter and PLC work correctly with a defined signal, further diagnostics can focus on the sensor, pipeline, medium or real flow conditions. If the evaluation is already wrong during simulation, parameterization or wiring must be corrected first.
For traceable testing, the simulated values should be documented. These include frequency, pulse count, assumed K-factor, expected flow, expected quantity, displayed value, input type, signal level and any deviation. Clean documentation is especially important for test benches, dosing systems and quality-relevant processes.
For combined transmitters that additionally output an analog signal such as 4–20 mA, this signal path should also be tested separately. The UPS4E loop calibrator is suitable for this. Frequency or pulse simulation checks the digital counting chain, while current loop testing evaluates the analog signal transmission.
Practical example: turbine flow meter shows incorrect flow on the counter
In a test bench, a turbine flow meter is used for volumetric flow measurement. The sensor provides a pulse signal that is routed to a digital display with counter function. After replacing the display, it becomes apparent that the flow fluctuates plausibly, but the displayed quantity is significantly too high. At first, the turbine flow meter is suspected as a possible source of error.
To narrow down the cause, the real sensor is disconnected and a simulator is connected to the input of the display. First, a defined frequency is simulated that should correspond to a medium operating flow. However, the display shows a flow that is too high. Then a fixed number of pulses is output. The counted quantity is also too high.
The electrical signal test therefore shows that the display basically detects the input signal, but is incorrectly scaled. During parameterization, an incorrect K-factor is found: the new display was set to pulses per cubic meter, while the calibration report of the turbine flow meter specifies the K-factor in pulses per liter. After correcting the unit, simulated flow and counted quantity match.
Only after that is the turbine flow meter reconnected and checked with real flow. The example shows that simulation of frequency and pulse signals prevents unnecessary disassembly and helps distinguish sensor errors from evaluation errors.
Which measuring instruments / products are suitable?
A multifunction calibrator such as the WIKA CPH8000 portable multifunction calibrator is suitable for simulating frequency and pulse signals. It supports the measurement and simulation of various electrical signals as well as frequency and pulses. This allows the evaluation of flow meters, counters, PLC inputs and process displays to be tested in a targeted manner.
The category simulators is the right starting point when signals need to be reproduced in a targeted way. Depending on the device, electrical signals, sensor signals, temperature variables or process signals can be simulated. For frequency and pulse applications, it should be explicitly checked whether the selected device supports the required frequency range, pulse count and suitable signal level.
For real flow applications, turbine flow meters are particularly relevant. They detect volumetric flow via the speed of a rotor in the flow channel and often output a pulse or frequency signal proportional to the flow rate. During commissioning, replacement of displays or PLC integration, checking the K-factor and input scaling is particularly important.
In addition, the category flow measurement technology can be used when other measuring principles such as electromagnetic flow meters, ultrasonic, Coriolis, vortex, gear meters or variable area flow meters are to be considered in addition to turbine flow meters. Depending on version, many of these devices also provide pulse, frequency, relay, analog or communication signals that must match the evaluation.
| Product / area | Typical use | Particularly relevant for |
|---|---|---|
| WIKA CPH8000 multifunction calibrator | Simulation and measurement of electrical signals, frequency and pulses | PLC inputs, counters, displays, test benches and commissioning |
| Simulators | Targeted reproduction of sensor and process signals | Signal testing, troubleshooting, scaling checks and functional testing |
| Turbine flow meters | Volumetric flow measurement with pulse or frequency output | K-factor, flow display, quantity counting, dosing and test bench |
| Flow measurement technology | Selection of different flow measurement principles | Volumetric flow, mass flow, process integration, signal type and measuring principle selection |
| UPS4E loop calibrator | Testing and simulation of 4–20 mA signals | Analog parallel outputs, PLC scaling and troubleshooting on current loops |
Conclusion: always test frequency and pulse as a complete measurement chain
Frequency and pulse signals are widely used in flow measurement. They are ideal for turbine flow meters, counters, dosing systems, test benches and PLC applications. At the same time, they require correct evaluation. K-factor, unit, time base, signal level, input circuitry, limit frequency and pulse width must match.
Simulating such signals is a very effective method for troubleshooting. It shows whether the display, counter or PLC calculates the expected flow and expected quantity correctly. This makes it possible to quickly distinguish whether a problem lies in the sensor or in the electrical evaluation.
The most important recommendation is: do not consider frequency and pulse signals merely as wires at the input. The complete measurement chain consisting of sensor, K-factor, cable, signal level, input, software, counter logic and documentation is decisive. Anyone who checks these relationships finds scaling errors faster and avoids incorrect flow or quantity values.
FAQ: frequently asked questions about simulating frequency and pulse signals
What is a frequency signal in a flow meter?
A frequency signal consists of pulses per second. In many flow meters, the frequency is proportional to the current flow rate. The higher the flow, the higher the frequency.
What is a pulse signal?
A pulse signal consists of individual electrical pulses. Each pulse can represent a defined quantity. By counting the pulses, the total quantity can be calculated.
What does K-factor mean?
The K-factor indicates how many pulses a flow meter generates per defined quantity unit, for example pulses per liter. It is the basis for converting pulses into flow rate or quantity.
Why is the K-factor so important?
An incorrect K-factor directly leads to incorrect flow or quantity values. Even if the sensor works electrically correctly, the evaluation displays incorrect values if the K-factor is wrong.
How can a frequency signal be simulated?
With a suitable calibrator or simulator, a defined frequency is generated. This frequency is applied to the display, counter or PLC input and compared with the expected flow value.
How do you test a quantity counter?
A simulator outputs a defined number of pulses. The counter must calculate the correct quantity from this. If the value deviates, K-factor, unit, counter function or input setting must be checked.
Can a turbine flow meter be tested without real flow?
The mechanical function of the turbine flow meter cannot be fully tested without real flow. However, the electrical evaluation, display, PLC scaling and counter function can be tested very well with a simulated frequency or pulse signal.
What is the difference between sensor testing and signal testing?
Sensor testing evaluates the real flow meter in the process or on the test bench. Signal testing evaluates whether a display, counter or PLC correctly evaluates a defined electrical signal.
Why does a counter count too little?
Possible causes include frequency that is too high, pulses that are too short, filter time that is too long, an unsuitable input or signal level problems. Incorrect edge evaluation can also lose pulses.
Why does a counter count too much?
A counter may count interference, contact bounce or both edges of a signal. Incorrect filter settings or EMC problems can also generate additional pulses.
What is a high-speed counter?
A high-speed counter is a fast counting input of a PLC or module. It is designed to detect fast pulse sequences more reliably than a standard digital input.
Why is a normal digital input often not sufficient?
Standard digital inputs have limited switching speeds and filter times. With fast flow pulses, they can lose pulses or detect the frequency value incorrectly.
Which signal levels can occur with flow meters?
Depending on the sensor, PNP, NPN, open collector, push-pull, NAMUR, TTL or other signal forms can occur. Output and input must be electrically compatible.
What does open collector mean?
An open-collector output usually switches against a reference potential and requires suitable pull-up circuitry. Without suitable input circuitry, the signal may not be detected correctly.
How do you check PLC scaling?
A defined frequency or pulse count is simulated, and the expected flow rate or expected quantity is calculated from K-factor and unit. The PLC value is then compared with the expected value.
Why does the flow value jump at low frequency?
At low frequency, there are only a few pulses per measurement window. If the time window is too short, the calculation fluctuates more strongly. Adjusted averaging can help.
Does simulation replace flow calibration?
No. Simulation checks the electrical evaluation and parameterization. Real flow calibration checks the sensor with real medium or on a suitable test bench.
Which devices are suitable for frequency and pulse simulation?
Multifunction calibrators or simulators that can measure or simulate frequency and pulses are suitable. The required frequency range, pulse count, signal level and connection options are important.