


Variable frequency drives enable energy-efficient and flexible speed control of motors. At the same time, together with switched-mode power supplies, LED drivers, UPS systems, chargers and other power-electronic consumers, they are among the typical non-linear loads found in modern industrial and building installations.
A non-linear load no longer draws current as a clean sinusoidal waveform. Instead, pulsed or significantly distorted current waveforms occur. In addition to the 50 Hz fundamental component, these currents contain further frequency components referred to as harmonics.
A TRMS current clamp can generally determine the true RMS value of a distorted current more accurately than an instrument designed only for sinusoidal signals. Nevertheless, a single TRMS value does not answer the key questions: Which harmonics are present? How high is the voltage distortion? Is a transformer subjected to additional loading? Are critical neutral conductor currents occurring? And do the problems occur continuously or only during specific production states?
Two installations can have the same RMS current and still place entirely different loads on the electrical network. The TRMS value describes the overall thermally effective magnitude of the signal, but it does not show its spectral composition, time profile, phase relationship or individual power quality events.
For a reliable assessment, voltage and current must therefore be recorded simultaneously, the individual harmonic orders must be analysed and the values must be logged over a representative operating period. This article explains what TRMS can provide, where its limitations lie and how the network effects of variable frequency drives can be investigated correctly.
Table of contents
- What are harmonics?
- Why variable frequency drives generate harmonics
- What a TRMS measurement actually shows
- Why the RMS value alone is not sufficient
- Harmonic spectrum and harmonic order
- Distinguishing correctly between voltage and current THD
- Current distortion and voltage distortion
- Neutral conductor loading caused by harmonics
- Heating of cables, transformers and equipment
- Power factor, cos φ and distortion reactive power
- Do not confuse harmonics with EMC
- Distinguishing between the mains input and motor output of the variable frequency drive
- Suitable measuring points in the installation
- Why a snapshot is often not sufficient
- Measurement setup for a power quality analysis
- Evaluating measured values correctly
- Typical fault patterns and possible causes
- Reactors, filters and other countermeasures
- Practical example: Transformer becomes too hot despite moderate TRMS current
- Documenting the measurement and results
- Which measuring instruments / products are suitable?
- Conclusion
- Frequently asked questions about harmonics and variable frequency drives
What are harmonics?
In an ideal AC power system, voltage and current have a sinusoidal fundamental waveform. In European low-voltage networks, its frequency is usually 50 Hz.
If the sinusoidal waveform is distorted, the signal can be represented mathematically as a superposition of the fundamental wave and additional sinusoidal frequency components. These additional components are referred to as harmonics.
The frequency of a harmonic corresponds to an integer multiple of the fundamental frequency. In a 50 Hz network, for example, the third harmonic has a frequency of 150 Hz, the fifth harmonic 250 Hz and the seventh harmonic 350 Hz.
| Harmonic order | Frequency at 50 Hz | Typical significance |
|---|---|---|
| 1st | 50 Hz | Fundamental component and intended mains frequency |
| 3rd | 150 Hz | Can heavily load the neutral conductor with single-phase non-linear loads |
| 5th | 250 Hz | Frequently relevant component in conventional three-phase rectifier circuits |
| 7th | 350 Hz | Also frequently present in six-pulse rectifiers |
| 11th and 13th | 550 and 650 Hz | Further typical components of certain rectifier topologies |
The harmonics that actually occur depend on the consumer circuit, network impedance, load, installed reactors, filters and other connected equipment. The mere statement that a variable frequency drive is present is therefore not sufficient to determine the complete harmonic spectrum.
In addition to integer harmonics, interharmonics, high-frequency switching components and transient events may also occur. These phenomena must be distinguished in measurement terms because they have different causes and cannot be detected equally reliably by every measuring instrument.
Why variable frequency drives generate harmonics
In simplified terms, a variable frequency drive consists of a mains-side rectifier, a DC link and a motor-side inverter. The rectifier converts the AC mains voltage into a DC voltage. The inverter uses this to generate a variable output voltage and frequency for the motor.
Many conventional variable frequency drives use a six-pulse diode rectifier with a DC-link capacitor at the input. The capacitor draws current mainly when the instantaneous mains voltage is sufficiently high. As a result, the input current does not flow evenly throughout the entire sine wave period, but in pronounced current pulses.
This pulsed current contains a valid fundamental component, but also several harmonics. In typical six-pulse circuits, the fifth, seventh, eleventh and thirteenth harmonics are often particularly prominent. The actual amplitudes, however, vary depending on the instrument design and operating condition.
A line reactor or DC-link reactor can smooth the current peaks and reduce the harmonic content. Multi-pulse input circuits, active front ends and so-called low-harmonic variable frequency drives can also exhibit different mains behaviour.
For this reason, it must not be assumed that every variable frequency drive produces the same network effects. Even instruments with the same motor rating can differ considerably due to rectifier topology, DC-link capacitance, integrated reactors and current load.
What a TRMS measurement actually shows
TRMS stands for True Root Mean Square. The RMS value describes the thermal effect produced by an alternating current in an ohmic resistance compared with a direct current.
With a sinusoidal current waveform, the RMS value can be derived easily from the peak value. With a distorted waveform, this calculation is no longer sufficient. A genuine TRMS measuring instrument samples the signal waveform and determines the RMS value independently of the ideal sine wave shape.
A TRMS measurement is therefore fundamentally important when variable frequency drives or other non-linear loads are present. A simple average-responding measuring instrument can show significant deviations with strongly distorted currents.
A correctly determined TRMS current helps, for example, when assessing the basic thermal loading of a conductor, the utilisation of a circuit and the actual current demand of a load.
However, the TRMS value combines all recorded frequency components into a single numerical value. It does not show how much current is attributable to the fundamental component and how much to individual harmonics.
Why the RMS value alone is not sufficient
A TRMS value can be correct and still provide insufficient information for fault analysis. A measured current of 100 A, for example, does not indicate whether the current is nearly sinusoidal or consists of narrow current pulses with a high peak value.
This distinction is relevant when sizing and assessing certain items of equipment. Transformers, motors, capacitors, reactors and switching devices react not only to the total current, but in some cases also to the frequency, peak value, time profile and phase relationship of the individual signal components.
| Measured variable | What it shows | What it does not show completely |
|---|---|---|
| TRMS current | Total RMS value and basic thermal current loading | Individual harmonics, phase relationship and cause of distortion |
| TRMS voltage | Effective voltage value | Waveform distortion, voltage dips and rapid changes |
| THD | Total harmonic content relative to the fundamental component | Which individual harmonic dominates and how high the absolute current is |
| Harmonic spectrum | Amplitude of the individual harmonic orders | Long-term profile if only a snapshot is taken |
| Waveform | Shape, current peaks and visible distortion | Automatic standards-based assessment without further evaluation |
| Long-term recording | Changes across load states, shifts and production cycles | Cause without suitable measuring points and knowledge of the installation |
A TRMS measuring instrument also has technical limits. With very narrow current pulses, the bandwidth and permissible crest factor of the instrument must be sufficient. If the permissible crest factor is exceeded or relevant frequency components lie outside the measuring bandwidth, even the displayed TRMS value may be incorrect.
TRMS is therefore neither incorrect nor unnecessary. It is an essential measured variable, but for assessing network effects it is usually only one part of the required analysis.
Harmonic spectrum and harmonic order
The harmonic spectrum shows the magnitude of the individual harmonic frequency components. The values can be displayed in volts, amperes or as a percentage relative to the fundamental component.
This display helps to identify possible sources. If, for example, the fifth and seventh harmonics dominate at the inputs of several conventional variable frequency drives, a different technical assessment is required than in the case of a high third harmonic caused by numerous single-phase switched-mode power supplies.
The harmonic order also influences the effect on equipment. As the frequency increases, additional eddy current and remagnetisation losses may occur. Capacitors have a lower impedance at higher frequencies and can therefore be subjected to higher harmonic currents.
A single THD value cannot reveal these differences. Two measurements with identical THD can have completely different spectra. Analysis of the individual harmonics is therefore required when selecting a filter or assessing a possible resonance.
During evaluation, harmonics should be considered both as percentages and as absolute current or voltage values. A high percentage with a very small total load may be less critical than a lower percentage with a very high installation current.
Distinguishing correctly between voltage and current THD
THD stands for Total Harmonic Distortion and describes the total harmonic distortion relative to the fundamental component. For a complete network assessment, voltage THD and current THD must be considered separately.
Voltage distortion is often designated THDU or THDV. It describes the extent to which the mains voltage deviates from the ideal sinusoidal waveform.
Current distortion is designated THDI. It shows the magnitude of the sum of harmonic current components relative to the fundamental current.
A variable frequency drive can draw a strongly distorted current while the voltage at a high-capacity connection point remains comparatively little distorted. In a weak network with high impedance, however, the same current can cause significantly greater voltage distortion.
A high THDI value does not automatically mean that the installation is critically loaded. If a variable frequency drive is operating only at low load, for example, the fundamental current may be small. Even moderate harmonic currents can then produce a high percentage value.
For this reason, at least the following values should be considered together during assessment:
- Total TRMS current
- Fundamental current
- Current THD
- Absolute currents of the relevant harmonics
- Voltage THD
- Absolute voltage components of the individual harmonics
- Operating condition and utilisation of the installation
Current distortion and voltage distortion
Non-linear loads initially generate a distorted current. This current flows through the impedances of cables, transformers, reactors and the upstream supply system.
Frequency-dependent voltage drops occur across these impedances. As a result, the originally largely sinusoidal supply voltage can also become distorted.
The degree of voltage distortion therefore depends not only on the load. Short-circuit power, transformer size, cable length, conductor cross-section, network structure and other consumers also play a role.
A high-capacity network can absorb considerable harmonic currents without the voltage becoming heavily distorted. In a weak subdistribution system or at the end of a long supply cable, even a smaller non-linear load can cause visible voltage problems.
When assessing a customer installation, it must therefore be established whether the mains voltage is already distorted when it enters the installation or whether the distortion is generated mainly within the installation itself. Measurements at the point of supply and at individual outgoing feeders help to distinguish between these possibilities.
Neutral conductor loading caused by harmonics
In a symmetrically loaded three-phase network with sinusoidal currents, the currents of the three phase conductors largely cancel each other in the neutral conductor. With non-linear single-phase loads, however, this is not the case for certain harmonics.
The third, ninth and fifteenth harmonics in particular belong to the so-called triplen harmonics. These components are in phase in all three phases and can add together in the neutral conductor instead of cancelling each other out.
The neutral conductor can therefore be heavily loaded even though the phase currents appear to be distributed evenly. This problem frequently occurs in installations with many switched-mode power supplies, computers, LED drivers and single-phase electronic loads.
A conventional three-phase variable frequency drive without a neutral conductor connection does not normally cause the same neutral conductor problem as a large number of single-phase switched-mode power supplies. In real industrial installations, however, both groups of consumers are often present.
A power quality analysis in a four-wire network should therefore also record the neutral conductor current. Measuring only the three phase conductors is not sufficient if neutral conductor overload is suspected.
In addition to the magnitude of the neutral current, its harmonic spectrum must be analysed. Only then can it be established whether an unbalanced fundamental load or mainly triplen harmonics are causing the loading.
Heating of cables, transformers and equipment
Harmonic currents increase the total RMS current and therefore generally increase the ohmic losses in conductors. At higher frequencies, additional losses can also arise due to skin effect, eddy currents and frequency-dependent magnetic effects.
Transformers can therefore become hotter than an assessment based solely on the transmitted active power would suggest. Winding losses and eddy current losses in particular can increase due to harmonic currents.
Motors can also experience additional losses, heating, noise or torque pulsations due to a distorted supply voltage. However, a distinction must be made between a distorted mains voltage at a directly connected motor and the normal PWM output of a variable frequency drive.
Capacitors in power factor correction systems can absorb harmonic currents and consequently become thermally overloaded. At the same time, the network inductance and correction capacitance can form a resonant circuit that amplifies certain harmonics.
Circuit breakers and fuses react primarily to current and heat. Strongly distorted currents with high peak values can, however, influence the behaviour of electronic trip units, current transformers and other components.
If equipment becomes unusually hot even though the measured TRMS current is below the rated value, harmonics should therefore be investigated in addition to contact resistances, ventilation and ambient temperature.
Power factor, cos φ and distortion reactive power
With sinusoidal voltage and sinusoidal current, the power factor is often described using the phase displacement angle between the two quantities. The corresponding value is referred to as cos φ.
With strongly distorted currents, this angle alone is not sufficient. A variable frequency drive may have a relatively good displacement factor and still have a poorer total power factor because harmonic currents produce additional apparent power.
A simple measuring instrument that displays only cos φ may therefore present the actual loading too favourably. A power analyser should measure active power, apparent power, reactive power and the true power factor.
Conventional reactive power compensation using capacitors does not eliminate harmonic currents. Carelessly extending a compensation system can even increase resonance and overload problems when harmonics are present.
Before any changes are made to a compensation system, the harmonic spectrum, network impedance and existing detuning reactors must therefore be checked.
Do not confuse harmonics with EMC
Harmonics are often generally described as an EMC problem. Although both topics concern unwanted electrical interference, they involve different frequency ranges and measuring methods.
Mains harmonics are low-frequency components of the supply voltage and mains current. A power quality analyser typically records the fundamental component and a defined number of harmonic orders.
The rapidly switching inverter of a variable frequency drive additionally generates high-frequency voltage edges, common-mode currents and conducted or radiated interference. These effects can influence motor bearings, cables, sensor lines, communication systems and residual current protective devices.
A conventional harmonic analysis does not fully cover these high-frequency EMC effects. Depending on the question, a suitable oscilloscope, high-voltage differential probes, high-frequency current clamps or standards-compliant EMC measuring equipment may be required.
Conversely, an EMC measurement does not replace the recording of THD, harmonic currents, load profiles and mains voltage events. Before measurement, it must therefore be clarified whether a power quality, motor, insulation or EMC problem is being investigated.
Distinguishing between the mains input and motor output of the variable frequency drive
The mains voltage is present at the input of a variable frequency drive. This is where the network effects of the rectifier are investigated. Typical measured variables include input current, mains voltage, active power, power factor, THD and the individual harmonics.
At the output, by contrast, the variable frequency drive generates a pulse-width-modulated voltage with steep switching edges. Depending on its bandwidth and measuring method, a conventional multimeter or power quality analyser may evaluate this voltage incorrectly.
Measurements at the motor output may therefore only be carried out using instruments and accessories that are expressly suitable for variable frequency drive outputs and the voltages, frequencies and switching edges occurring there.
A power quality analyser designed for 50 or 60 Hz supply networks must not automatically be used for detailed PWM output analysis. In addition to possible measurement errors, the high DC-link voltages and rapid voltage peaks impose considerable safety requirements.
For questions concerning mains harmonics, measurements are therefore normally performed on the input side of the variable frequency drive or at the higher-level point of common connection.
Suitable measuring points in the installation
The correct measuring point depends on the question to be answered. A measurement directly at the variable frequency drive shows its local input current. A measurement at the main distribution board, by contrast, shows the combined effect of all connected consumers.
| Measuring point | Possible information obtained | Special consideration |
|---|---|---|
| Input of an individual variable frequency drive | Current consumption, local harmonics and behaviour at different load states | Other consumers continue to influence the voltage |
| Outgoing feeder of a machine distribution board | Total network loading of the machine | Several variable frequency drives and switched-mode power supplies are combined |
| Transformer secondary side | Total load, voltage distortion and transformer utilisation | Suitable for assessing the overall operational effect |
| Point of supply or point of common connection | Network effects of the complete installation on the supply system | Particularly relevant for limit-value and contractual assessments |
| Neutral conductor of a four-wire distribution system | Unbalance and triplen harmonics | A separate current channel is required |
| Power factor correction system | Capacitor current, resonance and harmonic loading | Measurement only while observing installation safety |
Measurements at several points are often required for root-cause analysis. If the investigation starts only at the main distribution board, an abnormal harmonic current cannot automatically be assigned to a specific consumer.
Step-by-step measurement from the incoming supply through subdistribution boards to individual consumers helps to identify the responsible section of the installation.
Why a snapshot is often not sufficient
The current consumption of a variable frequency drive changes with motor torque, speed, process condition and production utilisation. Network impedance and the number of simultaneously active consumers also change during the course of the day.
A five-minute measurement during a quiet operating state can therefore produce a completely different result from a recording taken during production start-up, load changes, cleaning or maximum utilisation.
Long-term measurement is particularly important for intermittent faults. Voltage dips, short-term overloads or high harmonic values may occur for only a few seconds or minutes and remain undetected in a snapshot measurement.
The required measurement duration cannot be specified generally. It must cover at least one representative operating cycle. Depending on the application, this may be one machine batch, a complete shift, several production days or an entire week.
Typical installation states should be documented before the measurement. These include the start of a shift, product changes, simultaneously operating machines, compressors, pumps, welding systems, chargers and other large or non-linear consumers.
A time-synchronised recording enables a network event to be compared later with the actual production sequence.
Measurement setup for a power quality analysis
Work on electrical distribution systems may only be performed by appropriately qualified personnel in compliance with the applicable operational safety rules. The measuring instrument, cables, voltage connections and current sensors must be suitable for the voltage, current and measurement category of the installation.
In a three-phase four-wire installation, the three phase voltages, neutral reference and three phase currents are usually recorded. If neutral conductor loading is also to be investigated, a fourth current channel is required.
The current sensors must be installed in the correct direction and on the corresponding conductor. Swapped phases, reversed current clamps or incorrectly assigned voltage channels result in incorrect power and phase values.
The vector diagram should be checked before recording begins. An implausible diagram frequently indicates an incorrect phase assignment or current transformer direction.
The network configuration, nominal voltage, frequency, current transformer range and required recording interval must also be configured correctly. An excessively large current range can reduce resolution at low loads.
For harmonic analysis, at least the voltage and current of all relevant phases, THD, individual harmonics, power factor, active, reactive and apparent power, and minimum, maximum and average values should be recorded.
If network events are suspected, voltage dips, swells, interruptions, unbalance and inrush currents should also be recorded.
Evaluating measured values correctly
Evaluation does not begin with a single limit value, but with the question of whether the measurement is technically plausible. Phase sequence, clamp direction, nominal values and installation state must correspond to the documentation.
The current and voltage profiles are then examined over time. Abnormal points in time can be compared with production states, switching operations and consumer start-ups.
The THD values show when the overall distortion increases or decreases. The spectrum of the individual harmonics is then examined. This reveals whether the same orders always dominate or whether the spectrum changes with the load state.
A high current THD at low load should not be assessed in isolation. The absolute harmonic current and the resulting voltage distortion at the network point being considered are also decisive.
Where voltage distortion is high, it is checked whether it is already present at the incoming supply or only increases downstream of a particular consumer or subdistribution board.
The neutral conductor current is compared separately with the phase currents. A high neutral current with relatively balanced phase currents may indicate triplen harmonics.
A final assessment must take into account the applicable standards, grid connection conditions, manufacturer specifications and the specific point of common connection. A general THD value does not replace an application-specific assessment.
Typical fault patterns and possible causes
| Observation | Possible cause | Recommended measurement |
|---|---|---|
| Transformer or cable becomes unusually warm | High RMS current, additional harmonic losses, poor connection or overload | Record TRMS, harmonic spectrum, power and temperature profile |
| Neutral conductor current is higher than expected | Unbalanced load or triplen harmonics | Measure neutral current and individual harmonics of all phases |
| Power factor correction system repeatedly fails | Harmonic capacitor loading or resonance | Check capacitor current, spectrum, mains voltage and detuning reactors |
| Variable frequency drives report sporadic undervoltage | Voltage dip, high network utilisation or weak supply | Record voltage events and load profile over an extended period |
| TRMS current is inconspicuous but mains voltage is distorted | Combined effect of several consumers or pre-existing distortion from the supply network | Compare THD and spectrum at the incoming supply and subdistribution boards |
| Power factor is worse than the displayed cos φ | Distortion components in the current | Record active power, apparent power, total power factor and THD together |
| Current clamp reading is unstable or implausible | Unsuitable measuring range, insufficient bandwidth or incorrect clamp position | Check instrument specifications, crest factor and connection |
Many of these fault patterns can have several causes at the same time. A warm cable is not necessarily caused by harmonics. Likewise, a high THD may be present without being the cause of the specific fault.
The measurement should therefore not only confirm a suspected cause, but should also consider alternative fault sources such as loose terminals, undersizing, insufficient cooling and defective protective devices.
Reactors, filters and other countermeasures
The correct countermeasure depends on the harmonic spectrum, network impedance, consumer structure and the required improvement objective. A filter must not be selected solely on the basis of a high THD value.
Line reactors or DC-link reactors can reduce current peaks and improve the input current behaviour of certain variable frequency drives. The achievable effect depends on the impedance and the drive design.
Passive harmonic filters use tuned combinations of inductors, capacitors and, in some cases, resistors. They can be effective for defined loads and frequency ranges, but must match the network structure.
Active harmonic filters measure the distorted load current and inject compensating currents. They are particularly useful when load states and harmonic spectra change considerably.
Multi-pulse rectifier circuits, active front ends or low-harmonic drives can produce lower network effects by design. These solutions are particularly worth considering in new installations or for large individual drives.
Distributing consumers differently, using a higher-capacity transformer, shortening cables or adapting the network structure can also reduce voltage distortion at the critical connection point.
Power factor correction capacitors must not be used as a general solution for harmonics. If incorrectly designed, they can amplify certain frequencies and become overloaded themselves.
Before a filter or compensation measure is installed, reliable measurements under typical and maximum operating conditions should be available. Its effectiveness must then be verified by a comparative measurement.
Practical example: Transformer becomes too hot despite moderate TRMS current
In a production facility, several pumps, fans and conveyor drives are operated using variable frequency drives. During the main shift, the supply transformer becomes considerably hotter than expected in the original installation design.
An initial check using a TRMS current clamp shows that the phase currents are below the transformer rated current. The load is also distributed relatively evenly across the three phases. Based on this individual measurement, an electrical overload initially appears unlikely.
Because the increased temperature regularly occurs only during full production, a three-phase power quality analyser is installed on the transformer secondary side. Voltage, phase currents, active and apparent power, power factor, THD and individual harmonics are recorded over several production days.
The measurement shows that although the installation does not draw an excessively high total current continuously, the current is significantly distorted. Certain harmonic current components rise considerably, particularly when several variable frequency drives operate simultaneously.
The total power factor is also lower than the previously examined cos φ values suggested. Voltage distortion also increases during periods of maximum production, but remains considerably lower at an upstream measuring point.
This makes it clear that the network impedance of the local transformer and distribution system, together with the distorted load currents, contributes to the loading. The TRMS value was not incorrect, but it had not revealed either the spectral composition or the time relationship.
Technical measures are evaluated on the basis of the measured spectrum. These include checking existing DC-link reactors, possible active filtering and the transformer’s load capacity with non-linear loads.
After the selected measure has been implemented, the measurement is repeated under comparable production conditions. Only the before-and-after comparison shows whether harmonic currents, voltage distortion and thermal loading have actually been reduced sufficiently.
Documenting the measurement and results
Traceable documentation should clearly describe the measuring location, network system, installation state, connected consumers and measurement period.
The measuring instrument, current sensors used, measuring ranges, connection method, sampling or recording interval and calibration status must also be recorded.
The key results include voltage and current profiles, TRMS values, voltage and current THD, individual harmonics, power values, neutral conductor current and relevant network events.
Special installation states should be marked in the time profile. These include machine start-up, full load, no-load operation, production changes, filter activation and the shutdown of large consumers.
For a comparative measurement, the measuring point, instrument configuration and operating state should be as identical as possible. Otherwise, changes cannot be assigned clearly to the implemented measure.
If a standards-based or contractual power quality assessment is to be carried out, the measuring method, measurement duration and instrument class must comply with the applicable requirements. A general diagnostic measurement is not automatically equivalent to a standards-compliant conformity measurement.
Which measuring instruments / products are suitable?
For investigating harmonics, power factor, network loading and energy consumption, the power and energy analysers category contains various portable network analysers, energy recorders and power measurement clamps.
For a detailed investigation of variable frequency drives and other non-linear loads, the instrument should measure voltage and current simultaneously on all relevant phases. In four-wire networks, an additional current channel for the neutral conductor is particularly useful.
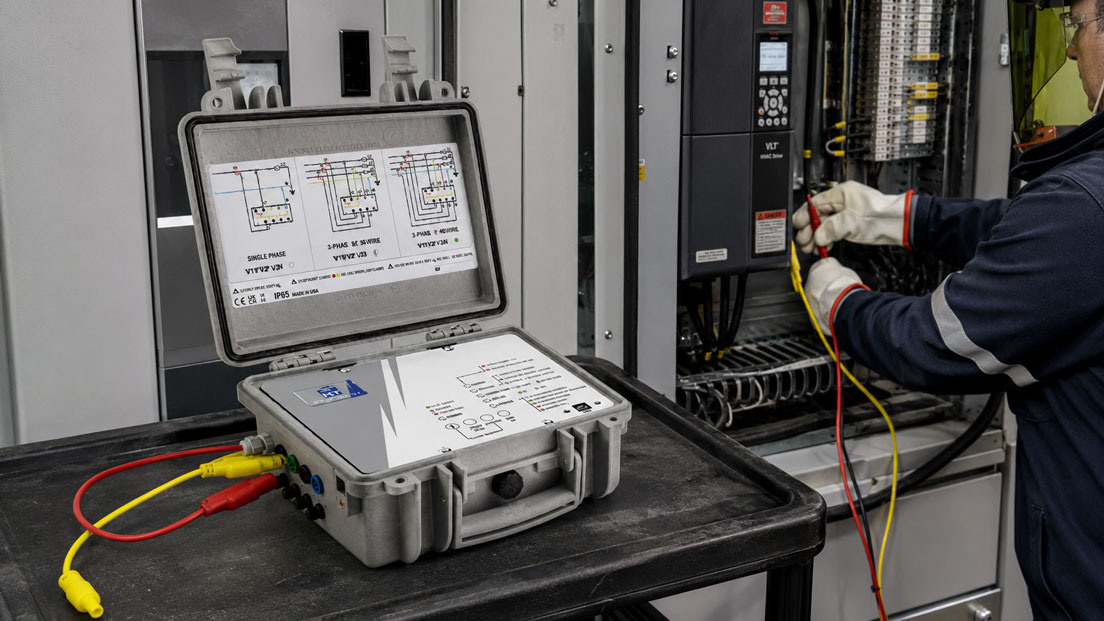
The PQA 820 power quality analyser has four voltage and four current channels. It calculates THD for voltage and current, analyses the individual harmonics and enables long-term recording of power, energy and network parameters.
The PQA 820 is therefore suitable both for three-phase measurements at the input of a variable frequency drive and for investigations on machine distribution systems, transformers and four-wire networks with a neutral conductor.
The VEGA74 three-phase network analyser is also suitable for comprehensive power quality investigations. In addition to TRMS, power and energy measurements, it can record voltage and current harmonics, THD, neutral current, unbalance, waveforms and network events.
Power and harmonic measurement clamps can be useful for a quick preliminary investigation. They allow, for example, TRMS current, power, power factor and, in some cases, individual harmonics to be checked directly at a load.
For a complete root-cause analysis, however, point measurements with a current clamp are often not sufficient. If simultaneous voltage measurement, multiple current channels and long-term recording are not available, combined effects, neutral conductor problems and time-dependent network events may remain undetected.
Energy recorders are particularly suitable when load profiles, energy consumption and long-term power fluctuations are the main focus. If a detailed harmonic assessment is also required, the harmonic and power quality functions supported by the specific model must be checked.
ICS Schneider Messtechnik assists with selection based on the network configuration, nominal voltage, maximum current, measuring point, required measurement duration, current sensors and desired evaluation. For measurements at variable frequency drive outputs, it must be clarified explicitly whether the instrument is suitable for PWM voltages and rapid switching edges.
Conclusion: TRMS is important, but not sufficient for a power quality analysis
A TRMS measurement shows the true RMS value of a distorted current or voltage. It is therefore much more informative with variable frequency drives and other non-linear loads than a simple measurement designed for sinusoidal waveforms.
However, the RMS value alone does not show which harmonics are present, how strongly the mains voltage is distorted or why transformers, neutral conductors and compensation systems are subjected to unusual loading.
For a reliable analysis, voltage and current must be measured simultaneously. In addition to THD, the individual harmonic orders, absolute harmonic currents, power factor, neutral conductor current, waveform and time profile must be considered.
The choice of measuring point is particularly important. A measurement directly at the variable frequency drive answers a different question from a measurement at the transformer or point of common connection.
The measurement duration must also match the operation. Many network problems occur only during certain load states, production cycles or when several consumers operate simultaneously and remain invisible during a short snapshot measurement.
Only after a complete measurement can reactors, passive or active filters, changes to the network structure or other measures be designed on a sound technical basis and assessed by means of a comparative measurement.
Frequently asked questions about harmonics and variable frequency drives
What are harmonics in the electrical network?
Harmonics are sinusoidal frequency components whose frequency corresponds to an integer multiple of the fundamental frequency. In a 50 Hz network, for example, the fifth harmonic has a frequency of 250 Hz.
Why do variable frequency drives generate harmonics?
Many variable frequency drives draw mains current through a rectifier circuit and DC link in current pulses rather than continuously. This distorts the current waveform and produces harmonic frequency components.
Does every variable frequency drive generate the same harmonics?
No. The spectrum depends on the rectifier topology, DC link, integrated reactors, filtering, network impedance and load. Active front ends and low-harmonic drives can behave very differently from simple six-pulse instruments.
What does TRMS mean?
TRMS means True Root Mean Square. The value describes the thermal effect of an alternating current or voltage even with a non-sinusoidal waveform.
Is a TRMS current clamp useful with variable frequency drives?
Yes. For distorted currents, it generally provides a more accurate RMS value than a simple average-responding measuring instrument. However, a single TRMS value is not sufficient for a complete harmonic and power quality analysis.
Why is TRMS alone not sufficient?
TRMS combines the fundamental component and all recorded harmonics into one total value. It does not show the individual harmonic orders, voltage distortion, phase relationship, neutral conductor loading or changes over time.
Can a TRMS measuring instrument also measure incorrectly?
Yes. The measuring bandwidth, current range and permissible crest factor must suit the waveform. Very narrow current pulses or high-frequency components may lie outside the technical limits of the instrument.
What is the crest factor?
The crest factor is the ratio between the peak value and RMS value. Strongly pulsed currents often have a high crest factor and place greater demands on the measuring instrument.
What does THD mean?
THD means Total Harmonic Distortion. The value describes the total harmonic distortion relative to the fundamental component and is usually stated as a percentage.
What is the difference between voltage THD and current THD?
Voltage THD describes the distortion of the mains voltage. Current THD describes the distortion of the current drawn. A load can cause high current THD without immediately producing high voltage THD in a strong network.
Is high current THD always critical?
Not necessarily. At low load, the fundamental current may be small, causing the percentage value to increase significantly. In addition to THD, the absolute harmonic currents and the resulting voltage distortion must therefore be assessed.
Which harmonics are typical of variable frequency drives?
With conventional six-pulse input rectifiers, the fifth, seventh, eleventh and thirteenth harmonics in particular are frequently present. However, the actual spectrum must be measured and can vary considerably depending on the design.
Why can harmonics heat transformers?
In addition to increased ohmic losses, harmonic currents can cause frequency-dependent eddy current and additional losses. As a result, a transformer can become hotter than its transmitted active power alone would suggest.
Why can the neutral conductor become overloaded?
Triplen harmonics such as the third, ninth and fifteenth harmonics can add together in the neutral conductor of a three-phase four-wire system. The neutral current can therefore be high even when the phase currents are relatively balanced.
Does a three-phase variable frequency drive load the neutral conductor?
A typical three-phase variable frequency drive is operated without a neutral conductor and therefore does not directly produce the same neutral current as single-phase switched-mode power supplies. However, other non-linear loads in the overall installation may generate relevant neutral conductor harmonics.
Can the neutral conductor current be higher than the individual phase currents?
Under unfavourable conditions with many single-phase non-linear consumers, very high neutral conductor loading is possible. The neutral conductor should therefore be measured separately in such installations.
What is the difference between cos φ and power factor?
Cos φ mainly describes the phase displacement of the fundamental components. The total power factor also includes current distortion. With non-linear loads, the two values can differ significantly.
Can power factor correction eliminate harmonics?
A conventional capacitor system primarily compensates phase-shifted reactive power. It does not eliminate harmonic currents and can cause resonance or increased capacitor loading if designed incorrectly.
What is the difference between harmonics and high-frequency EMC?
Harmonics are low-frequency multiples of the mains fundamental frequency. High-frequency EMC interference is caused, among other things, by the rapid switching edges of power electronics. The two phenomena sometimes require different measuring instruments and assessment methods.
Can a power quality analyser be used at the motor output of a variable frequency drive?
Only if the instrument and accessories are expressly suitable for PWM output voltages, switching frequencies and the voltage peaks that occur. A conventional network analyser for 50 Hz systems is not automatically suitable.
Where should measurements be taken on a variable frequency drive?
To assess network effects, measurements are usually taken at the input of the variable frequency drive, at the machine feeder, at the transformer or at the point of common connection. The correct point depends on the specific question.
How long should a harmonic measurement take?
The measurement should cover at least one representative operating cycle. Depending on the installation, this may be one shift, several production days or a week. Intermittent problems often require a longer recording period.
Why should voltage and current be measured simultaneously?
Only simultaneous measurement makes it possible to assess how distorted load currents affect the mains voltage. Power, power factor and phase relationships are also determined reliably only when voltage and current channels are assigned correctly.
Are four current sensors required in a four-wire network?
Four current channels are useful for complete recording of the three phase conductors and the neutral conductor. Without a separate neutral current channel, a possible neutral conductor overload may remain undetected.
Can a current clamp measure harmonics?
Certain power and harmonic measurement clamps can display THD and individual harmonic orders. For multi-phase long-term recording and a complete power quality analysis, however, a multi-channel network analyser is usually more suitable.
How can harmonics be reduced?
Possible measures include line or DC-link reactors, passive or active filters, multi-pulse rectifiers, active front ends and low-harmonic drives. Selection must be based on measurements and a technical network assessment.
Does a line reactor always help?
A line reactor can reduce current peaks and certain harmonic components. Its actual effect, however, depends on its impedance, the variable frequency drive and the network structure. It does not replace a measurement.
When is an active harmonic filter useful?
An active filter can be advantageous with varying loads and several different non-linear consumers. It generates compensating currents that counteract the measured harmonic load currents.
Can the PQA 820 measure harmonics?
Yes. The PQA 820 records voltage and current over several channels, calculates THD for voltage and current and analyses the individual harmonics. Power and energy values can also be recorded over extended periods.
Which information is required when selecting a network analyser?
Important information includes the network configuration, nominal voltage, maximum current, number of phases and neutral conductor, required measurement duration, measuring point, required harmonic order, current sensors, measurement category and desired power quality or event functions.