
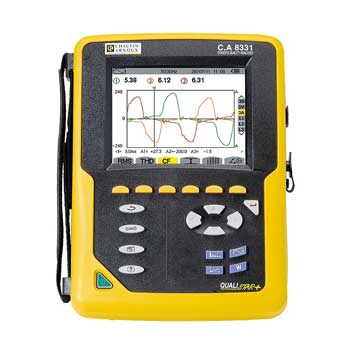
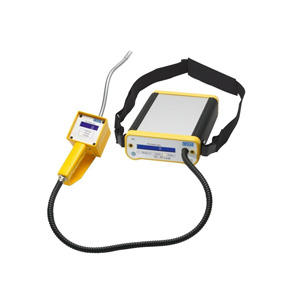
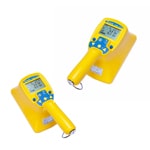


- Graphical display of trends with multiple parameters and waveform up to 600 Hz
- Multiple analytical tools: time/date-stamped Min/Max/Avg and Peak monitoring, filtering, duty cycle
- Optimized ergonomics: IP67 watertight casing, safety measurement terminals as per IEC61010 1000V CAT III/600V CAT IV, power supply via USB charger
- Top-of-the-range specifications: 100 kcts, 200 kHz bandwidth and 0.02% accuracy
- Communication: USB, BT and ANDROID application via the SX-DMM software delivered, SCPI programming commands
 Datasheet Datasheet |
| User Manual |
- Graphical display of trends with multiple parameters and waveform up to 600 Hz
- Multiple analytical tools: time/date-stamped Min/Max/Avg and Peak monitoring, filtering, duty cycle
- Optimized ergonomics: IP67 watertight casing, safety measurement terminals as per IEC61010 1000V CAT III/600V CAT IV, power supply via USB charger
- Top-of-the-range specifications: 100 kcts, 200 kHz bandwidth and 0.02% accuracy
- Communication: USB, BT and ANDROID application via the SX-DMM software delivered, SCPI programming commands
| Datasheet |
| User Manual |
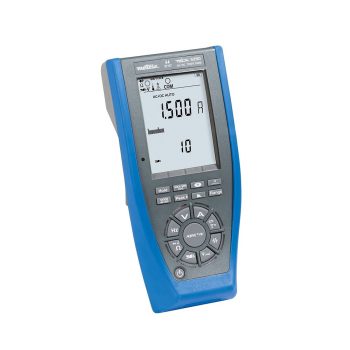
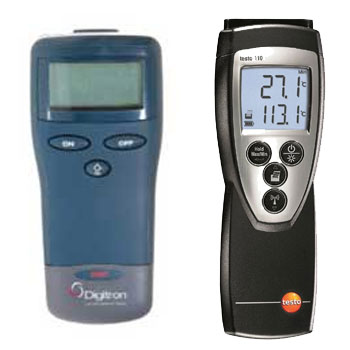
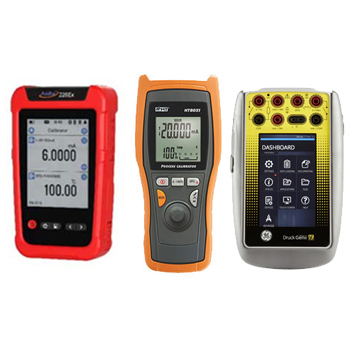
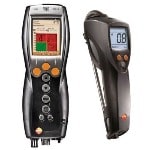
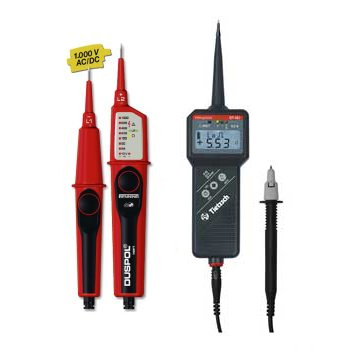
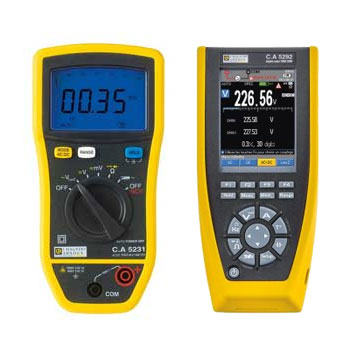
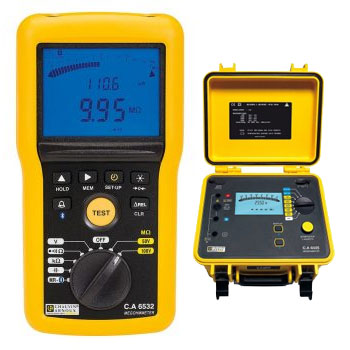
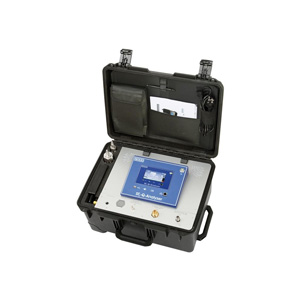
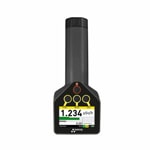
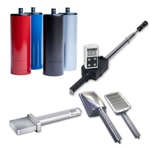
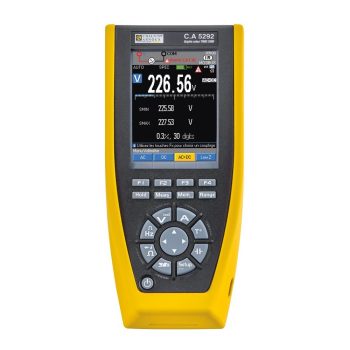
These portable multimeters with digital display allowing direct measurement of the main electrical quantities benefit from an innovative design making them compact, rugged, leakproof and comfortable to grip.
|
Datasheet
|
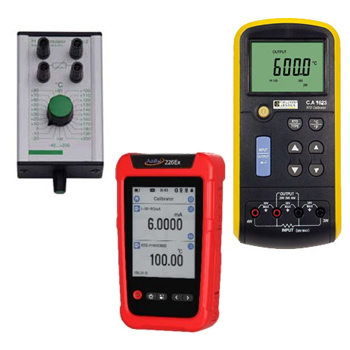
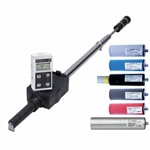
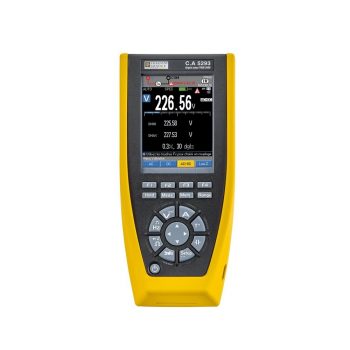
These portable multimeters with digital display allowing direct measurement of the main electrical quantities benefit from an innovative design making them compact, rugged, leakproof and comfortable to grip.
|
Datasheet
|
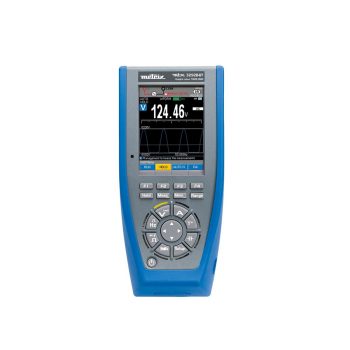
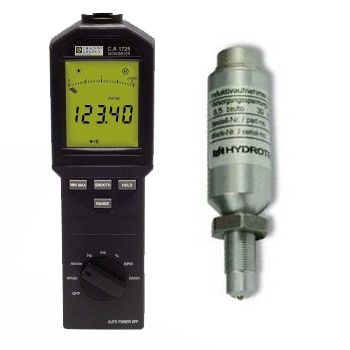
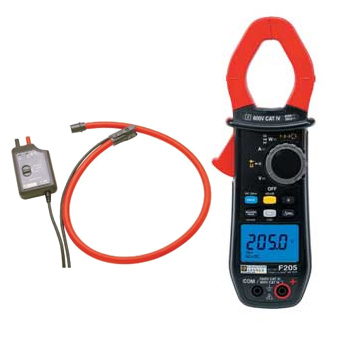
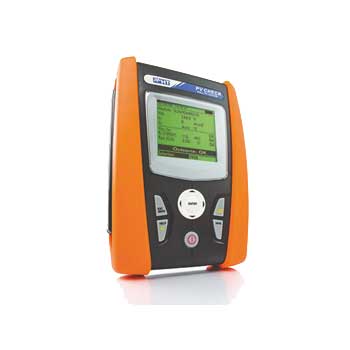
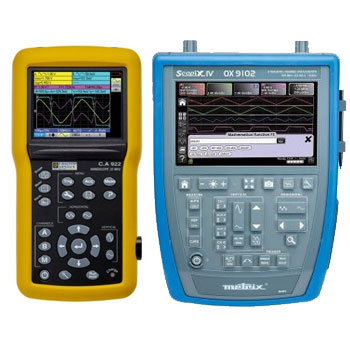
High-performance graphical multimeters...
- Easy-to-read 320 x 240-pixel colour matrix screen with black background
- Graphical display of trends and multiple parameters on a summary screen / 600 Hz waveform
- Trace, cursors and zoom on recordings
- Recording of 10 sequences
- Storage of up to 10,000 measurements
- Simplified setting of the number of measurements, interval, duration and storage capacity
- Internal storage of measurement 10 sequences
- Interactive zoom function on the recordings
- A simple surveillance mode displaying the time/date-stamped MIN/MAX/AVG and PEAK values
- Contextual reminder of the connections
- Normal USB communication or Bluetooth available as an option / ANDROID application
- IP67 protection against water projections and dust, ideal for outdoor conditions
- Ni-MH AA rechargeable battery, the best solution in terms of quality and price
- Operation for up to 100 hrs on batteries with management of the battery charge level
- No time-wasting: the instrument operates while charging
 Datasheet Datasheet |
